Class 12

Samacheer Kalvi 12th Business Maths Solutions Chapter 2 Integral Calculus I Ex 2.6

Students can download 12th Business Maths Chapter 2 Integral Calculus I Ex 2.6 Questions and Answers, Samacheer Kalvi 12th Business Maths Book Solutions Guide Pdf helps you to revise the complete Tamilnadu State Board New Syllabus and score more marks in your examinations.

Tamilnadu Samacheer Kalvi 12th Business Maths Solutions Chapter 2 Integral Calculus I Ex 2.6

Integrate the following with respect to x.

Question 1.
\(\frac{2 x+5}{x^{2}+5 x-7}\)
Solution:
Samacheer Kalvi 12th Business Maths Solutions Chapter 2 Integral Calculus I Ex 2.6 Q1

Question 2.
\(\frac{e^{3 \log x}}{x^{4}+1}\)
Solution:
Samacheer Kalvi 12th Business Maths Solutions Chapter 2 Integral Calculus I Ex 2.6 Q2

Question 3.
\(\frac{e^{2 x}}{e^{2 x}-2}\)
Solution:
Samacheer Kalvi 12th Business Maths Solutions Chapter 2 Integral Calculus I Ex 2.6 Q3

Question 4.
\(\frac{(\log x)^{3}}{x}\)
Solution:
Samacheer Kalvi 12th Business Maths Solutions Chapter 2 Integral Calculus I Ex 2.6 Q4

Question 5.
\(\frac{6 x+7}{\sqrt{3 x^{2}+7 x-1}}\)
Solution:
Samacheer Kalvi 12th Business Maths Solutions Chapter 2 Integral Calculus I Ex 2.6 Q5

Question 6.
\((4 x+2) \sqrt{x^{2}+x+1}\)
Solution:
\((4 x+2) \sqrt{x^{2}+x+1}\)
Let f(x) = x2 + x + 1
then f'(x) = 2x + 1
Samacheer Kalvi 12th Business Maths Solutions Chapter 2 Integral Calculus I Ex 2.6 Q6

Question 7.
x8 (1 + x9)5
Solution:
Samacheer Kalvi 12th Business Maths Solutions Chapter 2 Integral Calculus I Ex 2.6 Q7

Question 8.
\(\frac{x^{e-1}+e^{x-1}}{x^{e}+e^{x}}\)
Solution:
Samacheer Kalvi 12th Business Maths Solutions Chapter 2 Integral Calculus I Ex 2.6 Q8

Question 9.
\(\frac{1}{x \log x}\)
Solution:
Samacheer Kalvi 12th Business Maths Solutions Chapter 2 Integral Calculus I Ex 2.6 Q9

Question 10.
\(\frac{x}{2 x^{4}-3 x^{2}-2}\)
Solution:
Samacheer Kalvi 12th Business Maths Solutions Chapter 2 Integral Calculus I Ex 2.6 Q10
Samacheer Kalvi 12th Business Maths Solutions Chapter 2 Integral Calculus I Ex 2.6 Q10.1

Question 11.
ex (1 + x) log(x ex)
Solution:
∫ex(1 + x) log (xex) dx
= ∫z (ez) dz
= ∫udv = uv – u’v’
= (z) (ez) – (1) (ez)
= ez (z – 1) + c
= eilog(xex) (log (xex) – 1) + c
= xex (log (xex) – 1) + c
Take z = log (xex)
\(\frac { dz }{dx}\) = \(\frac { 1 }{xe^x}\) = (xex + ex)
xexdz = (xex + ex) dx
xexdz = ex (1 + x) dx
ezdz = ex(1 + x) dx

Question 12.
\(\frac{1}{x^{2}\left(x^{2}+1\right)}\)
Solution:
Samacheer Kalvi 12th Business Maths Solutions Chapter 2 Integral Calculus I Ex 2.6 Q12

Question 13.
\(e^{x}\left[\frac{1}{x^{2}}-\frac{2}{x^{3}}\right]\)
Solution:
Samacheer Kalvi 12th Business Maths Solutions Chapter 2 Integral Calculus I Ex 2.6 Q13

Question 14.
\(e^{x}\left[\frac{x-1}{(x+1)^{3}}\right]\)
Solution:
Samacheer Kalvi 12th Business Maths Solutions Chapter 2 Integral Calculus I Ex 2.6 Q14

Question 15.
\(e^{3 x}\left[\frac{3 x-1}{9 x^{2}}\right]\)
Solution:
Samacheer Kalvi 12th Business Maths Solutions Chapter 2 Integral Calculus I Ex 2.6 Q15

Samacheer Kalvi 12th Business Maths Solutions Chapter 2 Integral Calculus I Ex 2.6 Read More »

Samacheer Kalvi 12th Business Maths Solutions Chapter 10 Operations Research Ex 10.2

Students can download 12th Business Maths Chapter 10 Operations Research Ex 10.2 Questions and Answers, Samacheer Kalvi 12th Business Maths Book Solutions Guide Pdf helps you to revise the complete Tamilnadu State Board New Syllabus and score more marks in your examinations.

Tamilnadu Samacheer Kalvi 12th Business Maths Solutions Chapter 10 Operations Research Ex 10.2

Question 1.
What is the Assignment problem?
Solution:
Suppose that we have ‘m’ jobs to be performed on ‘n’ machines. The cost of assigning each job to each machine is Cij. (i = 1, 2,…, n and j = 1, 2,…. n).Our objective is to assign different jobs to different machines (one job per machine) to minimize the overall cost. This is known as the assignment problem.

Question 2.
Give the mathematical form of the assignment problem.
Solution:
The mathematical form of assignment problem is Minimize \(\mathrm{Z}=\sum_{i=1}^{n} \sum_{j=1}^{n} \mathrm{C}_{i j} x_{i j}\)
Subject to the constraints
Samacheer Kalvi 12th Business Maths Solutions Chapter 10 Operations Research Ex 10.2 1
(or) 1 for all i = 1, 2, …….. n and j = 1, 2, …….. n
where Cij is the cost of assigning ith job to jth machine and xij represents the assignment of ith job to jth machine.

Samacheer Kalvi 12th Business Maths Solutions Chapter 10 Operations Research Ex 10.2

Question 3.
What is the difference between Assignment Problem and Transportation Problem?
Solution:
The assignment problem is a special case of the transportation problem. The differences are given below.

Transportation Problem Assignment Problem
1. This is about reducing cost of transportation merchandise 1. This is about assigning finite sources to finite destinations where only one destination is allotted for one source with minimum cost
2. Number of sources and number of demand need not be equal 2. Number of sources and the number of destinations must be equal
3. If total demand and total supply are not equal then the problem is said to be unbalanced. 3. If the number of rows are not equal to the number of columns then problems are unbalanced.
4. It requires 2 stages to solve: Getting initial basic feasible solution, by NWC, LCM, VAM and optimal solution by MODI method 4. It has only one stage. Hungarian method is sufficient for obtaining an optimal solution

Question 4.
Three jobs A, B and C one to be assigned to three machines U, V and W. The processing cost for each job machine combination is shown in the matrix given below. Determine the allocation that minimizes the overall processing cost. (cost is in ₹ per unit)
Samacheer Kalvi 12th Business Maths Solutions Chapter 10 Operations Research Ex 10.2 2
Solution:
Here the number of rows and columns are equal.
the given assignment problem is balance.
Step 1: We select the smallest element from each row and subtract from other elements in its row.
Samacheer Kalvi 12th Business Maths Solutions Chapter 10 Operations Research Ex 10.2 3
Column V has no zero. Go to step 2.
Step 2: Select the smallest element from each column and subtract from other elements in its column.
Samacheer Kalvi 12th Business Maths Solutions Chapter 10 Operations Research Ex 10.2 4
Since each row and column contains at least one zero, assignments can be made.
Step 3: (Assignment)
Row A contains exactly one zero. We mark it by □ and other zeros in its column by x.
Samacheer Kalvi 12th Business Maths Solutions Chapter 10 Operations Research Ex 10.2 5
Now proceed column wise. Column V has exactly one zero. Mark by □ and other zeros in its row by X.
Samacheer Kalvi 12th Business Maths Solutions Chapter 10 Operations Research Ex 10.2 6
Now there is no zero in row B to assign the job. So proceed as follows. Draw a minimum number of lines to cover all the zeros in the reduced matrix. Subtract 5 from all the uncovered elements and add to the element at the intersection of 2 lines as shown below.
Samacheer Kalvi 12th Business Maths Solutions Chapter 10 Operations Research Ex 10.2 7
Now start the whole procedure once again for assignment to get the following matrix.
Samacheer Kalvi 12th Business Maths Solutions Chapter 10 Operations Research Ex 10.2 8
Thus all the 3 assignments have been made. The optimal assignment schedule and the total cost is
Job Machine Cost
Samacheer Kalvi 12th Business Maths Solutions Chapter 10 Operations Research Ex 10.2 9

Samacheer Kalvi 12th Business Maths Solutions Chapter 10 Operations Research Ex 10.2

Question 5.
A computer centre has got three expert programmers. The centre needs three application programmes to be developed. The head of the computer centre, after studying carefully the programmes to be developed, estimates the computer time in minutes required by the experts to the application programme as follows.
Samacheer Kalvi 12th Business Maths Solutions Chapter 10 Operations Research Ex 10.2 10
Assign the programmers to the programme in such a way that the total computer time is least.
Solution:
Here the number of rows equals the number of columns. So the given problem is balanced and we can find a solution.
Step 1:
Samacheer Kalvi 12th Business Maths Solutions Chapter 10 Operations Research Ex 10.2 11
Step 2:
Samacheer Kalvi 12th Business Maths Solutions Chapter 10 Operations Research Ex 10.2 12
Step 3: (Assignment)
Samacheer Kalvi 12th Business Maths Solutions Chapter 10 Operations Research Ex 10.2 13
Now all the 3 programmes have been assigned to the programmers. The optimal assignment schedule and the total cost is
Samacheer Kalvi 12th Business Maths Solutions Chapter 10 Operations Research Ex 10.2 14
The optimal assignment (minimum) cost is ₹ 280.

Question 6.
A departmental head has four subordinates and four tasks to be performed. The subordinates differ inefficiency and the tasks differ in their intrinsic difficulty. His estimates of the time each man would take to perform each task is given below
Samacheer Kalvi 12th Business Maths Solutions Chapter 10 Operations Research Ex 10.2 15
How should the tasks be allocated to subordinates so as to minimize the total man-hours?
Solution:
A number of tasks equal the number of subordinates. So the given problem is balanced and we can get an optimal solution.
Step 1: Subtract minimum hours of each row from other elements of that row.
Samacheer Kalvi 12th Business Maths Solutions Chapter 10 Operations Research Ex 10.2 16
Since column 2 has no zero, proceed further.
Step 2:
Samacheer Kalvi 12th Business Maths Solutions Chapter 10 Operations Research Ex 10.2 17
We can proceed with the assignment since all the rows and columns have zeros.
Step 3: (Assignment)
Samacheer Kalvi 12th Business Maths Solutions Chapter 10 Operations Research Ex 10.2 18
Now there is no zero in row S. So we proceed as below.
Samacheer Kalvi 12th Business Maths Solutions Chapter 10 Operations Research Ex 10.2 19
We have drawn the minimum number of lines to cover all the zeros in the reduced matrix obtained. The smallest element from all the uncovered elements is 1. We subtract this from all the uncovered elements and add them to the elements which lie at the intersection of two lines. Thus we obtain another reduced problem for fresh assignment.
Samacheer Kalvi 12th Business Maths Solutions Chapter 10 Operations Research Ex 10.2 20
Now all the subordinates have been assigned tasks. The optimal assignment schedule and the total cost is
Samacheer Kalvi 12th Business Maths Solutions Chapter 10 Operations Research Ex 10.2 21
The optimal assignment (minimum) hours = 41

Samacheer Kalvi 12th Business Maths Solutions Chapter 10 Operations Research Ex 10.2

Question 7.
Find the optimal solution for the assignment problem with the following cost matrix.
Samacheer Kalvi 12th Business Maths Solutions Chapter 10 Operations Research Ex 10.2 22
Solution:
Number of Areas = Number of salesmen.
So the given problem is balanced and we can find an optimal solution.
Step 1:
Samacheer Kalvi 12th Business Maths Solutions Chapter 10 Operations Research Ex 10.2 23
Step 2:
Samacheer Kalvi 12th Business Maths Solutions Chapter 10 Operations Research Ex 10.2 24
Step 3: (Assignment)
Samacheer Kalvi 12th Business Maths Solutions Chapter 10 Operations Research Ex 10.2 25
Now all the salesmen have been assigned areas.
The optimal assignment schedule and the total cost is
Samacheer Kalvi 12th Business Maths Solutions Chapter 10 Operations Research Ex 10.2 26
Thus the optimal cost is Rs. 37.

Question 8.
Assign four trucks 1, 2, 3 and 4 to vacant spaces A, B, C, D, E and F so that distance travelled is minimized. The matrix below shows the distance.
Samacheer Kalvi 12th Business Maths Solutions Chapter 10 Operations Research Ex 10.2 27
Solution:
Here the number of trucks is 4 and vacant spaces are 6. So the given assignment problem is the unbalanced problem. So we introduce two dummy columns with all the entries zero to make is balanced. So the problem is
Samacheer Kalvi 12th Business Maths Solutions Chapter 10 Operations Research Ex 10.2 28
Here only 4 vacant spaces can be assigned to four trucks
Step 1: Not necessary since all rows have zeros.
Step 2:
Samacheer Kalvi 12th Business Maths Solutions Chapter 10 Operations Research Ex 10.2 29
Step 3: (Assignment)
Samacheer Kalvi 12th Business Maths Solutions Chapter 10 Operations Research Ex 10.2 30
The optimal assignment schedule and total distance travelled is
Samacheer Kalvi 12th Business Maths Solutions Chapter 10 Operations Research Ex 10.2 31
Thus the minimum distance travelled is 12 km.

Samacheer Kalvi 12th Business Maths Solutions Chapter 10 Operations Research Ex 10.2 Read More »

Samacheer Kalvi 12th Business Maths Solutions Chapter 9 Applied Statistics Ex 9.3

Students can download 12th Business Maths Chapter 9 Applied Statistics Ex 9.3 Questions and Answers, Samacheer Kalvi 12th Business Maths Book Solutions Guide Pdf helps you to revise the complete Tamilnadu State Board New Syllabus and score more marks in your examinations.

Tamilnadu Samacheer Kalvi 12th Business Maths Solutions Chapter 9 Applied Statistics Ex 9.3

Question 1.
Define Statistical Quality Control.
Solution:
Statistical quality control (SQC) refers to the use of statistical methods in the monitoring and maintaining of the quality of products and services. This method is used to determine the tolerance limits for accepting a production process.

Question 2.
Mention the types of causes for variation in a production process.
Solution:
There are two causes of variations between items produced under identical conditions in large production process. They are called assignable causes and non-assignable causes (chance causes).

Samacheer Kalvi 12th Business Maths Solutions Chapter 9 Applied Statistics Ex 9.3

Question 3.
Define Chance Cause.
Solution:
The minor causes which do not affect the quality of the products to an extent are called as chance causes or Random causes. For example rain, floods, power cuts, etc.

Question 4.
Define Assignable Cause.
Solution:
The variations in input factors which are the causes for the variations in the output produc¬tions are called assignable causes. For example defective raw materials, fault in instruments used, fatigue of workers employed, unskilled technicians, worn out tools etc.

Samacheer Kalvi 12th Business Maths Solutions Chapter 9 Applied Statistics Ex 9.3

Question 5.
What do you mean by product control?
Solution:
Product control means controlling the quality of the product by a sampling technique called acceptance sampling. It aims at a certain quality level to he guaranteed to the customers. It is concerned with classification of raw materials, semi-finished goods or finished goods into acceptable or rejectable products.

Question 6.
What do you mean by process control?
Solution:
A production process is said to be under control if the products produced are according to the specifications; that is the characteristics are within the tolerance limits. This is tested through the control charts.

Samacheer Kalvi 12th Business Maths Solutions Chapter 9 Applied Statistics Ex 9.3

Question 7.
Define a control chart.
Solution:
Control charts are statistical tools to test whether a production process is under control. It was introduced by Watter.A.Shewhart. It is a simple technique used for detecting patterns of variations in the data. It consists of three lines namely, centre line (CL), Upper control limit (UCL) and Lower control limit (LCL)

Question 8.
Name the control charts for variables.
Solution:
A quality characteristic which can be expressed in terms of a numerical value in the production process is called as a variable. There are two types of control charts for variables.

  1. Mean chart (\(\bar{X}\) chart)
  2. Range chart (R chart).

Samacheer Kalvi 12th Business Maths Solutions Chapter 9 Applied Statistics Ex 9.3

Question 9.
Define the mean chart.
Solution:
The mean chart (\(\bar{X}\) chart) is used to show the quality averages of the samples taken from the given process. The mean of the samples is first calculated. Then the mean of the sample means is found to get the control limits.
Samacheer Kalvi 12th Business Maths Solutions Chapter 9 Applied Statistics Ex 9.3 1

Question 10.
Define R Chart.
Solution:
The R chart is used to show the variability or dispersion of the samples taken from the given process. The average range is given by \(\overline{\mathrm{R}}=\frac{\sum R}{n}\), where R = xmax – xmin for each ‘n’ samples. For samples of size less than 20, the range provides a good estimate of σ. Hence to measure the variance in the variable, range chart is used.

Samacheer Kalvi 12th Business Maths Solutions Chapter 9 Applied Statistics Ex 9.3

Question 11.
What are the uses of statistical quality control?
Solution:
The term Quality means a level or standard of a product which depends on Material, Manpower, Machines, and Management (4M’s). Quality Control ensures the quality specifications all along with them from the arrival of raw materials through each of their processing to the final delivery of goods. This technique is used in almost all’ production industries such as automobile, textile, electrical equipment, biscuits, bath soaps, chemicals, petroleum products etc.

Question 12.
Write the control limits for the mean chart.
Solution:
The calculation of control limits for \(\bar{X}\) chart in two different cases are
Samacheer Kalvi 12th Business Maths Solutions Chapter 9 Applied Statistics Ex 9.3 2

Samacheer Kalvi 12th Business Maths Solutions Chapter 9 Applied Statistics Ex 9.3

Question 13.
Write the control limits for the R chart.
Solution:
The calculation of control limits for R chart in two different cases are
Samacheer Kalvi 12th Business Maths Solutions Chapter 9 Applied Statistics Ex 9.3 3

Question 14.
A machine is set to deliver packets of a given weight. Ten samples of size five each were recorded. Below are given relevant data:
Samacheer Kalvi 12th Business Maths Solutions Chapter 9 Applied Statistics Ex 9.3 4
Calculate the control limits for the mean chart and the range chart and then comment on the state of control.
(conversion factors for n = 5, A2 = 0.58, D3 = 0 and D4 = 2.115)
Solution:
Samacheer Kalvi 12th Business Maths Solutions Chapter 9 Applied Statistics Ex 9.3 5
Samacheer Kalvi 12th Business Maths Solutions Chapter 9 Applied Statistics Ex 9.3 6
Samacheer Kalvi 12th Business Maths Solutions Chapter 9 Applied Statistics Ex 9.3 7
The above diagram shows all the three control lines with the data points plotted. We see that all the points of the sample mean are within the control limits.
We now draw the R chart for the given data.
Samacheer Kalvi 12th Business Maths Solutions Chapter 9 Applied Statistics Ex 9.3 8
The above diagram shows all the three control lines with the sample range points plotted. We observe that all the points are within the control limits.
Conclusion: From the above two plots of the sample mean \(\bar{X}\) and sample range R, we conclude that the process is in control.

Samacheer Kalvi 12th Business Maths Solutions Chapter 9 Applied Statistics Ex 9.3

Question 15.
Ten samples each of size five are drawn at regular intervals from a manufacturing process. The sample means (\(\bar{X}\)) and their ranges (R) are given below:
Samacheer Kalvi 12th Business Maths Solutions Chapter 9 Applied Statistics Ex 9.3 9
Calculate the control limits in respect of \(\bar{X}\) chart.
(Given A2 = 0.58, D3 = 0 and D4 = 2.115) Comment on the state of control
Solution:
Samacheer Kalvi 12th Business Maths Solutions Chapter 9 Applied Statistics Ex 9.3 10
Samacheer Kalvi 12th Business Maths Solutions Chapter 9 Applied Statistics Ex 9.3 11
Samacheer Kalvi 12th Business Maths Solutions Chapter 9 Applied Statistics Ex 9.3 12
Samacheer Kalvi 12th Business Maths Solutions Chapter 9 Applied Statistics Ex 9.3 13
Samacheer Kalvi 12th Business Maths Solutions Chapter 9 Applied Statistics Ex 9.3 14
From the \(\bar{X}\) chart, we see that 4 points are outside the control limit lines. So we say that the process is out of control.

Question 16.
Construct \(\bar{X}\) and R charts for the following data:
Samacheer Kalvi 12th Business Maths Solutions Chapter 9 Applied Statistics Ex 9.3 15
(Given for n = 3, A2 = 1.023, D3 = 0 and D4 = 2.574)
Solution:
We first find the sample mean and range for each of the 8 given samples.
Samacheer Kalvi 12th Business Maths Solutions Chapter 9 Applied Statistics Ex 9.3 16
Samacheer Kalvi 12th Business Maths Solutions Chapter 9 Applied Statistics Ex 9.3 17

Samacheer Kalvi 12th Business Maths Solutions Chapter 9 Applied Statistics Ex 9.3

Question 17.
The following data show the values of the sample mean (\(\bar{X}\)) and its range (R) for the samples of Size five each. Calculate the values for control limits for mean, range chart and determine whether the process is in control.
Samacheer Kalvi 12th Business Maths Solutions Chapter 9 Applied Statistics Ex 9.3 18
(conversion factors for n = 5, A2 = 0.58, D3 = 0 and D4 = 2.115)
Solution:
Samacheer Kalvi 12th Business Maths Solutions Chapter 9 Applied Statistics Ex 9.3 19
Samacheer Kalvi 12th Business Maths Solutions Chapter 9 Applied Statistics Ex 9.3 20
From the above control limits values we observe that all the sample means lie between the UCL and LCL (i.e.) 7.006 < \(\overline{\mathrm{x}}_{i}\) < 14.31 for i = 1, 2, 3,…….. 10. Also all the sample range value lie between the control limits for R (i.e) 0 < Ri < 13.32, i = 1, 2, 3,…., 10. Hence we conclude that the process is in control.

Question 18.
A quality control inspector has taken ten samples of size four packets each from a potato chips company. The contents of the sample are given below, Calculate the control limits for the mean and range chart.
Samacheer Kalvi 12th Business Maths Solutions Chapter 9 Applied Statistics Ex 9.3 21
(Given for n = 4, A2 = 0.729, D3 = 0 and D4 = 2.282)
Solution:
Samacheer Kalvi 12th Business Maths Solutions Chapter 9 Applied Statistics Ex 9.3 22
Samacheer Kalvi 12th Business Maths Solutions Chapter 9 Applied Statistics Ex 9.3 23

Samacheer Kalvi 12th Business Maths Solutions Chapter 9 Applied Statistics Ex 9.3

Question 19.
The following data show the values of sample means and the ranges for ten samples of size 4 each. Construct the control chart for mean and range chart and determine whether the process is in control
Samacheer Kalvi 12th Business Maths Solutions Chapter 9 Applied Statistics Ex 9.3 24
Solution:
Samacheer Kalvi 12th Business Maths Solutions Chapter 9 Applied Statistics Ex 9.3 25
Samacheer Kalvi 12th Business Maths Solutions Chapter 9 Applied Statistics Ex 9.3 26
From the values of the control limits for \(\bar{X}\), we observe that one sample \(\bar{X}\) value (45) is above the UCL and one sample \(\bar{X}\) value (14) is below the LCL. Hence we conclude that the process is out of control.

Question 20.
In a production process, eight samples of size 4 are collected and their means and ranges are given below. Construct a mean chart and range chart with control limits.
Samacheer Kalvi 12th Business Maths Solutions Chapter 9 Applied Statistics Ex 9.3 273
Solution:
Samacheer Kalvi 12th Business Maths Solutions Chapter 9 Applied Statistics Ex 9.3 28
Samacheer Kalvi 12th Business Maths Solutions Chapter 9 Applied Statistics Ex 9.3 274
From the values of the control limits for \(\bar{X}\), we observe that sample \(\bar{X}\) value 16 is above the UCL. Hence we conclude that the process is out of control.

Samacheer Kalvi 12th Business Maths Solutions Chapter 9 Applied Statistics Ex 9.3

Question 21.
In a certain bottling industry, the quality control inspector recorded the weight of each of the 5 bottles selected at random during each hour of four hours in the morning.
Samacheer Kalvi 12th Business Maths Solutions Chapter 9 Applied Statistics Ex 9.3 275
Solution:
Samacheer Kalvi 12th Business Maths Solutions Chapter 9 Applied Statistics Ex 9.3 276
Samacheer Kalvi 12th Business Maths Solutions Chapter 9 Applied Statistics Ex 9.3 29
From the above control limit values. We observe that all the sample \(\bar{X}\) values are within UCL and LCL values. Also, all the R values are also within UCL and LCL of R chart. Hence we conclude that the process is within Control.

Samacheer Kalvi 12th Business Maths Solutions Chapter 9 Applied Statistics Ex 9.3 Read More »

Samacheer Kalvi 12th Business Maths Solutions Chapter 8 Sampling Techniques and Statistical Inference Ex 8.1

Students can download 12th Business Maths Chapter 8 Sampling Techniques and Statistical Inference Ex 8.1 Questions and Answers, Samacheer Kalvi 12th Business Maths Book Solutions Guide Pdf helps you to revise the complete Tamilnadu State Board New Syllabus and score more marks in your examinations.

Tamilnadu Samacheer Kalvi 12th Business Maths Solutions Chapter 8 Sampling Techniques and Statistical Inference Ex 8.1

Question 1.
What is the population?
Solution:
A population is a set of similar items or events which is of interest for some question or experiment. A population can be specific or vague. Examples of population defined vaguely include the number of newborn babies in Tamil Nadu, a total number of tech startups in India, the average height of all exam candidates, mean weight of taxpayers in Chennai etc. Examples of population defined specifically include a number of fans produced in a particular factory, the number of students in a class, the number of boys and girls in a tuition centre etc.

Question 2.
What is the sample?
Solution:
A sample is a set of data collected from a statistical population by a defined procedure. The elements of a sample are called sample size or sample points. Samples are collected and statistics are calculated from the samples, so that one can make inferences from the sample to the population.

Samacheer Kalvi 12th Business Maths Solutions Chapter 8 Sampling Techniques and Statistical Inference Ex 8.1

Question 3.
What is statistic?
Solution:
A statistic is used to estimate the value of a population parameter. For instance, we selected a random sample of 100 students from a school with 1000 students. The average height of the sampled students would be an example of a statistic. Examples, sample variance, sample quartiles, sample percentiles, sample moments etc.

Question 4.
Define parameter.
Solution:
A parameter is any numerical quantity that characterizes a given population or some aspect of it. This means the parameter tells us something about the whole population. For example, the population mean µ, variance σ2, population proportion P, population correlation ρ.

Samacheer Kalvi 12th Business Maths Solutions Chapter 8 Sampling Techniques and Statistical Inference Ex 8.1

Question 5.
What is the sampling distribution of a statistic?
Solution:
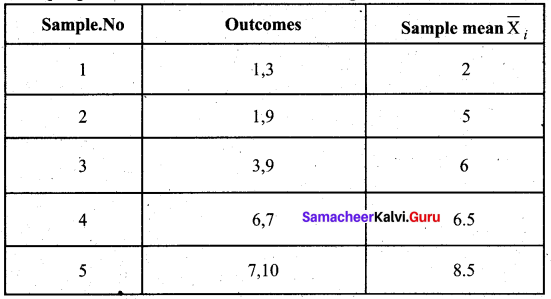
Sampling distribution of a statistic is the probability distribution of a given random sample based statistic. It may be considered as the distribution of the statistic for all possible samples from the same population of a given sample size.
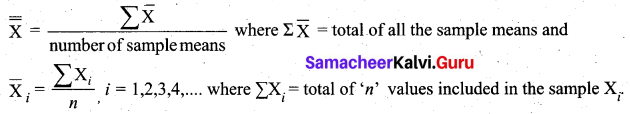
Example, the sampling distribution of the mean for n = 2 is given below:
Samacheer Kalvi 12th Business Maths Solutions Chapter 8 Sampling Techniques and Statistical Inference Ex 8.1 Q5

Question 6.
What is the standard error?
Solution:
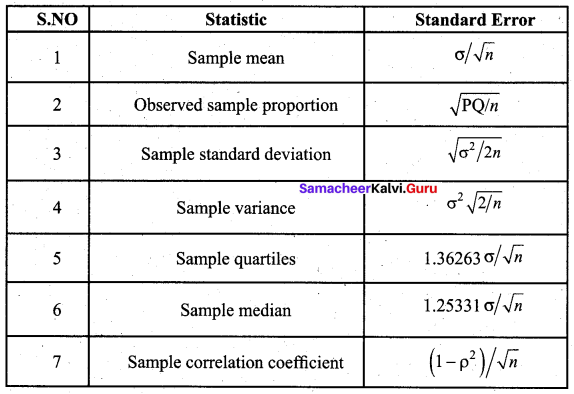
The standard error (S.E) of a statistic is the standard deviation of its sampling distribution. If the parameter or the statistic is the mean, it is called the standard error of the mean (SEM). The standard error provides a rough estimate of the interval in which the population parameters is likely to fall.
Samacheer Kalvi 12th Business Maths Solutions Chapter 8 Sampling Techniques and Statistical Inference Ex 8.1 Q6

Samacheer Kalvi 12th Business Maths Solutions Chapter 8 Sampling Techniques and Statistical Inference Ex 8.1

Question 7.
Explain in detail about simple random sampling with a suitable example.
Solution:
(i) Simple random sampling:
In this technique, the samples are selected in such a way that each and every unit in the population has an equal and independent chance of being selected as a sample. Simple random sampling may be done, with or without replacement of the samples selected. In a simple random sampling with replacement, there is a possibility of selecting the same sample any number of times. So, simple random sampling without replacement is followed.
Thus in simple random sampling from a population of N units, the probability of drawing any unit at the first draw is \(\frac{1}{N}\), the probability of drawing any unit in the second draw from among the available (N – 1) units is \(\frac{1}{(N-1)}\), and so on. Several methods have been adopted for random selection of the samples from the population. Of those, the following two methods are generally used and which are described below.

1. Lottery method
This is the most popular and simplest method when the population is finite. In this method, all the items of the population are numbered on separate slips of paper of the same size, shape and colour. They are folded and placed in a container and shuffled thoroughly. Then the required numbers of slips are selected for the desired sample size. The selection of items thus depends on chance.

For example, if we want to select 10 students, out of 100 students, then we must write the names/roll number of all the 100 students on slips of the same size and mix them, then we make a blindfold selection of 10 students. This method is called unrestricted random sampling because units are selected from the population without any restriction. This method is mostly used in lottery draws. If the population or universe is infinite, this method is inapplicable.

2. Table of Random number
When the population size is large, it is difficult to number all the items on separate slips of paper of same size, shape and colour. The alternative method is that of using the table of random numbers. The most practical, easy and inexpensive method of selecting a random sample can be done through “Random Number Table”. The random number table has been so constructed that each of the digits 0, 1, 2,…, 9 will appear approximately with the same frequency and independently of each other.

The various random number tables available are

  • L.H.C. Tippett random number series
  • Fisher and Yates random number series
  • Kendall and Smith random number series
  • Rand Corporation random number series.

Tippett’s table of random numbers is most popularly used in practice.

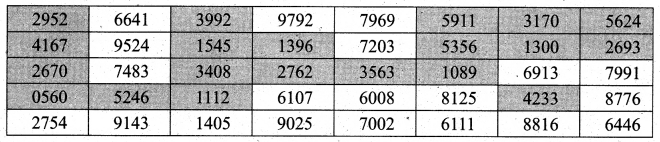
An example to illustrate how Tippett’s table of random numbers may be used is given below. Suppose we have to select 20 items out of 6,000. The procedure is to number all the 6,000 items from 1 to 6,000. A page from Tippett’s table may be selected and the first twenty numbers ranging from 1 to 6,000 are noted down. If the numbers are above 6000, choose the next number ranging from 1 to 6000. Items bearing those numbers will be selected as samples from the population. Making use of the portion of the random number table given, the required random samples are shaded. Here, we consider row-wise selection of random numbers.
Samacheer Kalvi 12th Business Maths Solutions Chapter 8 Sampling Techniques and Statistical Inference Ex 8.1 Q7

Question 8.
Explain the stratified random sampling with a suitable example.
Solution:
Stratified Random Sampling
In stratified random sampling, first divide the population into subpopulations, which are called strata. Then, the samples are selected from each of the strata through random techniques. The collection of all the samples from all strata gives the stratified random samples.

When the population is heterogeneous or different segments or groups with respect to the variable or characteristic under study, then the Stratified Random Sampling method is studied.. First, the population is divided into the homogeneous number of sub-groups or strata before the sample is drawn. A sample is drawn from each stratum at random. Following steps are involved in selecting a random sample in a stratified random sampling method.

Samacheer Kalvi 12th Business Maths Solutions Chapter 8 Sampling Techniques and Statistical Inference Ex 8.1

(a) The population is divided into different classes so that each stratum will consist of more or less homogeneous elements. The strata are so designed that they do not overlap each other.
(b) After the population is stratified, a sample of a specified size is drawn at random from each stratum using Lottery Method or Table of Random Number Method.

Stratified random sampling is applied in the field of the different legislative areas as strata in election polling, division of districts (strata) in a state etc…

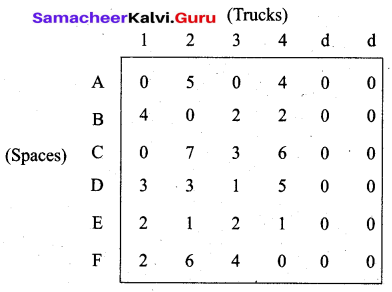
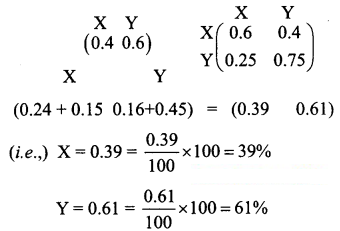
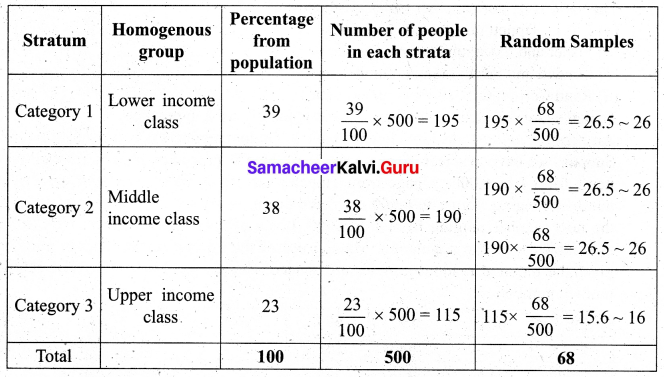
Ex: From the following data, select 68 random samples from the population of the heterogeneous group with a size of 500 through stratified random sampling, considering the following categories as strata.

  • Category 1: Lower income class – 39%
  • Category 2: Middle income class – 38%
  • Category 3: Upper income class – 23%

Solution:
Samacheer Kalvi 12th Business Maths Solutions Chapter 8 Sampling Techniques and Statistical Inference Ex 8.1 Q8

Question 9.
Explain in detail about systematic random sampling with example.
Solution:
Systematic sampling:
In systematic sampling, randomly select the first sample from the first k units. Then every kth member, starting with the first selected sample, is included in the sample.

Systematic sampling is a commonly used technique if the complete and up-to-date list of the sampling units is available. We can arrange the items in numerical, alphabetical, geographical or in any other order. The procedure of selecting the samples starts with selecting the first sample at random, the rest being automatically selected according to some pre-determined ( pattern. A systematic sample is formed by selecting every item from the population, where k refers to the sample interval. The sampling interval can be determined by dividing the size of the population by the size of the sample to be chosen.
That is k = \(\frac{\mathrm{N}}{n}\), where k is an integer.
k = Sampling interval, N = Size of the population, n = Sample size.

Procedure for selection of samples by systematic sampling method
(i) If we want to select a sample of 10 students from a class of 100 students, the sampling interval is calculated as \(k=\frac{N}{n}=\frac{100}{10}=10\)
Thus sampling interval = 10 denotes that for every 10 samples one sample has to be selected.
(ii) The first sample is selected from the first 10 (sampling interval) samples through random selection procedures.
(iii) If the selected first random sample is 5, then the rest of the samples are automatically selected by incrementing the value of the sampling interval (k = 10) i.e., 5, 15, 25, 35, 45, 55, 65, 75, 85, 95.

Samacheer Kalvi 12th Business Maths Solutions Chapter 8 Sampling Techniques and Statistical Inference Ex 8.1

Ex: Suppose we have to select 20 items out of 6,000. The procedure is to number all the 6,000 items from 1 to 6,000. The sampling interval is calculated as k = \(\frac{N}{n}=\frac{6000}{20}\) = 300. Thus sampling interval = 300 denotes that for every 300 samples one sample has to be selected. The first sample is selected from the first 300 (sampling interval) samples through random selection procedures. If the selected first random sample is 50, then the rest of the samples are automatically selected by incrementing the value of the sampling interval (k = 300) ie,50, 350, 650, 950, 1250, 1550, 1850, 2150, 2450, 2750, 3050, 3350, 3650, 3950, 4250, 4550, 4850, 5150, 5450, 5750. Items bearing those numbers will be selected as samples from the population.

Question 10.
Explain in detail about sampling error.
Solution:
Sampling Errors: Errors, which arise in the normal course of investigation or enumeration on account of chance, are called sampling errors. Sampling errors are inherent in the method of sampling. They may arise accidentally without any bias or prejudice.

Sampling Errors arise primarily due to the following reasons:

  • Faulty selection of the sample instead of the correct sample by defective sampling technique.
  • The investigator substitutes a convenient sample if the original sample is not available while investigation.
  • In area surveys, while dealing with borderlines it depends upon the investigator whether to include them in the sample or not. This is known as Faulty demarcation of sampling units.

Question 11.
Explain in detail about the non-sampling error.
Solution:
Non-Sampling Errors:
The errors that arise due to human factors which always vary from one investigator to another in selecting, estimating or using measuring instruments( tape, scale) are called Non-Sampling errors.
It may arise in the following ways:

  • Due to negligence and carelessness of the part of either investigator or respondents.
  • Due to the lack of trained and qualified investigators.
  • Due to the framing of a wrong questionnaire.
  • Due to applying the wrong statistical measure
  • Due to incomplete investigation and sample survey.

Question 12.
State any two merits of simple random sampling.
Solution:

  • In simple random sampling personal bias is completely eliminated.
  • This method is economical as it saves time, money and labour.

Question 13.
State any three merits of stratified random sampling.
Solution:

  • A random stratified sample is superior to a simple random sample because it ensures representation of all groups and thus it is more representative of the population which is being sampled.
  • A stratified random sample can be kept small in size without losing its accuracy.
  • It is easy to administer if the population under study is sub-divided.

Samacheer Kalvi 12th Business Maths Solutions Chapter 8 Sampling Techniques and Statistical Inference Ex 8.1

Question 14.
State any two demerits of systematic random sampling.
Solution:

  • Systematic samples are not random samples.
  • If N is not a multiple of n, then the sampling interval (k) cannot be an integer, thus sample selection becomes difficult.

Question 15.
State any two merits for systematic random sampling.
Solution:
Merits of systematic sampling are given below:

  • This method distributes the sample more evenly over the entire listed population.
  • The time and work are reduced much.

Question 16.
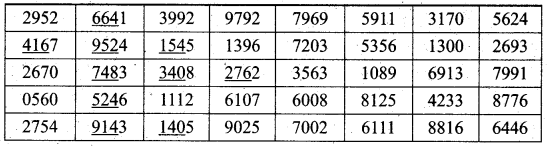
Using the following Tippet’s random number table.
Samacheer Kalvi 12th Business Maths Solutions Chapter 8 Sampling Techniques and Statistical Inference Ex 8.1 Q16
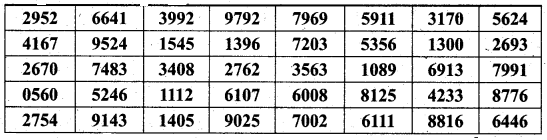
Draw a sample of 10 three-digit numbers which are even numbers.
Solution:
There are many ways to select a sample of 10 3-digit even numbers. From the table, start from the first number and move along the column. Select the first three digits as the number. If it is an odd number, move to the next number. The selected sample is 416, 664, 952, 748, 524, 914, 154, 340, 140, 276.
Samacheer Kalvi 12th Business Maths Solutions Chapter 8 Sampling Techniques and Statistical Inference Ex 8.1 Q16.1

Question 17.
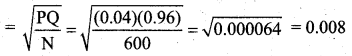
A wholesaler in apples claims that only 4 % of the apples supplied by him are defective. A random sample of 600 apples contained 36 defective apples. Calculate the standard error concerning good apples.
Solution:
Sample size = 600
No. of defective apples = 36
Sample proportion p = \(\frac{36}{600}\) = 0.06
Population proportion P = probability of defective apples = 4% = 0.04
Q = 1 – P = 1 – 0.04 = 0.96
The S.E for sample proportion is given by S.E
Samacheer Kalvi 12th Business Maths Solutions Chapter 8 Sampling Techniques and Statistical Inference Ex 8.1 Q17

Samacheer Kalvi 12th Business Maths Solutions Chapter 8 Sampling Techniques and Statistical Inference Ex 8.1

Question 18.
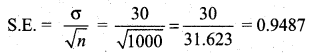
A sample of 1000 students whose mean weight is 119 lbs (pounds) from a school in Tamil Nadu State was taken and their average weight was found to be 120 lbs with a standard deviation of 30 lbs. Calculate the standard error of the mean.
Solution:
Given n = 1000, \(\bar{X}\) = 119, σ = 30
Samacheer Kalvi 12th Business Maths Solutions Chapter 8 Sampling Techniques and Statistical Inference Ex 8.1 Q18

Question 19.
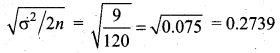
A random sample of 60 observations was drawn from a large population and its standard deviation was found to be 2.5. Calculate the suitable standard error that this sample is taken from a population with standard deviation 3?
Solution:
Given sample size n = 60
Sample standard deviation = 2.5
Population standard deviation σ = 3
The S.E is given by
Samacheer Kalvi 12th Business Maths Solutions Chapter 8 Sampling Techniques and Statistical Inference Ex 8.1 Q19

Samacheer Kalvi 12th Business Maths Solutions Chapter 8 Sampling Techniques and Statistical Inference Ex 8.1

Question 20.
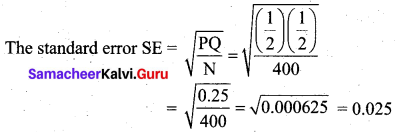
In a sample of 400 population from a village 230 are found to be eaters of vegetarian items and the rest non-vegetarian items. Compute the standard error assuming that both vegetarian and non-vegetarian foods are equally popular in that village?
Solution:
Given sample size 400 and 230 are vegetarian eaters.
So sample proportionp = \(\frac{230}{400}\) = 0.575
Population proportion P = Prob (vegetarian eaters from the village) = \(\frac{1}{2}\)
(Since vegetarian and non-vegetarian foods are equally popular)
Q = 1 – P = 1 – \(\frac{1}{2}\) = \(\frac{1}{2}\)
Samacheer Kalvi 12th Business Maths Solutions Chapter 8 Sampling Techniques and Statistical Inference Ex 8.1 Q20

Samacheer Kalvi 12th Business Maths Solutions Chapter 8 Sampling Techniques and Statistical Inference Ex 8.1 Read More »

Samacheer Kalvi 12th Business Maths Solutions Chapter 9 Applied Statistics Ex 9.2

Students can download 12th Business Maths Chapter 9 Applied Statistics Ex 9.2 Questions and Answers, Samacheer Kalvi 12th Business Maths Book Solutions Guide Pdf helps you to revise the complete Tamilnadu State Board New Syllabus and score more marks in your examinations.

Tamilnadu Samacheer Kalvi 12th Business Maths Solutions Chapter 9 Applied Statistics Ex 9.2

Question 1.
Define Index Number.
Solution:
“An Index Number is a device which shows by its variations the Changes in a magnitude which is not capable of accurate measurements in itself or of direct valuation in practice”. – Wheldon

“An Index number is a statistical measure of fluctuations in a variable arranged in the form of a series and using a base period for making comparisons” – Lawrence J Kalpan

Question 2.
State the uses of Index Number.
Solution:
The uses of Index number are as given below:

  • It is an important tool for formulating decision and management policies.
  • It helps in studying the trends and tendencies.
  • It determines the inflation and deflation in an economy

Samacheer Kalvi 12th Business Maths Solutions Chapter 9 Applied Statistics Ex 9.2

Question 3.
Mention the classification of Index Number.
Solution:
Classification of Index Numbers:
Index number can be classified as follows

  1. Price Index Number: It measures the general changes in the retail or wholesale price level of a particular or group of commodities.
  2. Quantity Index Number: These are indices to measure the changes in the number of goods manufactured in a factory.
  3. Cost of living Index Number: These are intended to study the effect of change in the price level on the cost of living of different classes of people.

Question 4.
Define Laspeyre’s price index number
Solution:
The weighted aggregate index number using base period weights is called Laspeyre’s price index number.
Samacheer Kalvi 12th Business Maths Solutions Chapter 9 Applied Statistics Ex 9.2 1
Where p1 is current year price
p0 is base year price
q0 is base year quantity

Samacheer Kalvi 12th Business Maths Solutions Chapter 9 Applied Statistics Ex 9.2

Question 5.
Explain Paasche’s price index number.
Solution:
If both prices and quantities were permitted to change, then it is impossible to isolate the part of movement due to price changes alone. In this case, the current year quantities appear more realistic weights than the base year quantities. The index number based on current year quantities is called Paasche’s price index number.
Samacheer Kalvi 12th Business Maths Solutions Chapter 9 Applied Statistics Ex 9.2 2
Where p1 is the current year price
q1 is the current year quantity
p0 is the base year price

Question 6.
Write a note on Fisher’s price index number.
Solution:
Fisher defined a weighted index number as the geometric mean of Laspeyre’s index number and Paasche’s Index number
Samacheer Kalvi 12th Business Maths Solutions Chapter 9 Applied Statistics Ex 9.2 3
The Fisher-price index number is also known as the “ideal” price index number. This requires more data than the other two index numbers and as a result, may often be impracticable. But this is a good index number because it satisfies both the time-reversal test and factor reversal test.
Samacheer Kalvi 12th Business Maths Solutions Chapter 9 Applied Statistics Ex 9.2 4

Samacheer Kalvi 12th Business Maths Solutions Chapter 9 Applied Statistics Ex 9.2

Question 7.
State the test of the adequacy of the index number.
Solution:
Index numbers are studied to know the- relative changes in price and quantity for any two years compared. There are two tests which are used to test the adequacy for an index number. The two tests are as follows

  • Time Reversal Test
  • Factor Reversal Test

The criterion for a good index number is to satisfy the above two tests.

Question 8.
Define Time Reversal Test.
Solution:
It is an important test for testing the consistency of a good index number. This test maintains time consistency by working both forward and backward with respect to time (here time refers to the base year and current year). Symbolically the following relationship should be satisfied, P01 × P10 = 1
Fisher’s index number formula satisfies the above relationship
Samacheer Kalvi 12th Business Maths Solutions Chapter 9 Applied Statistics Ex 9.2 5
when the base year and current year are interchanged, we get,
Samacheer Kalvi 12th Business Maths Solutions Chapter 9 Applied Statistics Ex 9.2 6

Samacheer Kalvi 12th Business Maths Solutions Chapter 9 Applied Statistics Ex 9.2

Question 9.
Explain Factor Reversal Test.
Solution:
Factor Reversal Test:
This is another test for testing the consistency of a good index number. The product of price index number and quantity index number from the base year to the current year should be equal to the true value ratio. That is the ratio between the total value of the current period and total value pf the base period is known as the true value ratio. Factor Reversal Test is given by,
Samacheer Kalvi 12th Business Maths Solutions Chapter 9 Applied Statistics Ex 9.2 7
where P01 is the relative change in price.
Q01 is the relative change in quantity.

Question 10.
Define true value ratio.
Solution:
The ratio between the total value of the current period and the total value of the base period is known as the true value ratio.
(i.e) true value ratio = \(\frac{\sum p_{1} q_{1}}{\sum p_{0} q_{0}}\)

Samacheer Kalvi 12th Business Maths Solutions Chapter 9 Applied Statistics Ex 9.2

Question 11.
Discuss Cost of Living Index Number.
Solution:
Cost of Living Index Number is constructed to study the effect of changes in the price of goods and services of consumers for a current period as compared with the base period. The change in the cost of living index number between any two periods means the change in income which will be necessary to maintain the same standard of living in both the periods. Therefore the cost of living index number measures the average increase in the cost to maintain the same standard of life.

Further, the consumption habits of people differ widely from class to class (rich, poor, middle class) and even with the region. The changes in the price level affect the different classes of people, consequently, the general price index numbers fail to reflect the effect of changes in their cost of living in different classes of people. Therefore, the cost of living index number measures the general price movement of the commodities consumed by different classes of people.

Question 12.
Define Family Budget Method.
Solution:
Family Budget Method:
In this method, the weights are calculated by multiplying prices and quantity of the base year.
(i.e.) V = Σp0q0. The formula is given by,
Cost of Living Index Number = \(\frac{\sum \mathrm{PV}}{\sum \mathrm{V}}\)
where P = \(\frac{p_{1}}{p_{0}} \times 100\) is the price relative
V = Σp0q0 is the value relative

Samacheer Kalvi 12th Business Maths Solutions Chapter 9 Applied Statistics Ex 9.2

Question 13.
State the uses of the Cost of Living Index Number.
Solution:
Uses of Cost of Living Index Number

  • It indicates whether the real wages of workers are rising or falling for a given time.
  • It is used by the administrators for regulating dearness allowance or grant of bonus to the workers.

Question 14.
Calculate by a suitable method, the index number of price from the following data:
Samacheer Kalvi 12th Business Maths Solutions Chapter 9 Applied Statistics Ex 9.2 8
Solution:
Samacheer Kalvi 12th Business Maths Solutions Chapter 9 Applied Statistics Ex 9.2 9
The Laspeyres price index number
Samacheer Kalvi 12th Business Maths Solutions Chapter 9 Applied Statistics Ex 9.2 10
Paasche’s price index number
Samacheer Kalvi 12th Business Maths Solutions Chapter 9 Applied Statistics Ex 9.2 11
On an average, there is an increase of 44.8% and 44.4% in the price of the commodities by Laspeyres and Paasche’s price index number respectively for the current year 2012 as compared with the base year 2002.

Samacheer Kalvi 12th Business Maths Solutions Chapter 9 Applied Statistics Ex 9.2

Question 15.
Calculate price index number for 2005 by (a) Laspeyre’s (b) Paasche’s method.
Samacheer Kalvi 12th Business Maths Solutions Chapter 9 Applied Statistics Ex 9.2 12
Solution:
Samacheer Kalvi 12th Business Maths Solutions Chapter 9 Applied Statistics Ex 9.2 13
Laspeyre’s price index number
Samacheer Kalvi 12th Business Maths Solutions Chapter 9 Applied Statistics Ex 9.2 14
Paasche’s price index number
Samacheer Kalvi 12th Business Maths Solutions Chapter 9 Applied Statistics Ex 9.2 15
On an average, there is an increase of 170.6% and 163.63% in the price of the commodities by Laspeyre’s and Paasche’s price index number respectively for the current year 2005 as compared with the base year 1995.

Question 16.
Compute (i) Laspeyre’s (ii) Paasche’s (iii) Fisher’s Index numbers for 2010 from the following data.
Samacheer Kalvi 12th Business Maths Solutions Chapter 9 Applied Statistics Ex 9.2 16
Solution:
Samacheer Kalvi 12th Business Maths Solutions Chapter 9 Applied Statistics Ex 9.2 17
Laspeyre’s price index number
Samacheer Kalvi 12th Business Maths Solutions Chapter 9 Applied Statistics Ex 9.2 18
Paasche’s price index number
Samacheer Kalvi 12th Business Maths Solutions Chapter 9 Applied Statistics Ex 9.2 19
Fisher’s price index number
Samacheer Kalvi 12th Business Maths Solutions Chapter 9 Applied Statistics Ex 9.2 20
On an average, there is an increase of 6.6%, 6.8% and 6.7% in the price of the commodities by Laspeyre’s, Paasche’s and Fisher’s index number respectively for the current year 2010 as compared to the base year 2000.

Samacheer Kalvi 12th Business Maths Solutions Chapter 9 Applied Statistics Ex 9.2

Question 17.
Using the following data, construct Fisher’s Ideal index and show how it satisfies Factor Reversal Test and Time Reversal Test?
Samacheer Kalvi 12th Business Maths Solutions Chapter 9 Applied Statistics Ex 9.2 21
Solution:
Samacheer Kalvi 12th Business Maths Solutions Chapter 9 Applied Statistics Ex 9.2 22
Fisher’s ideal index
Samacheer Kalvi 12th Business Maths Solutions Chapter 9 Applied Statistics Ex 9.2 23
Time reversal test:
To prove P01 × P10 = 1

Samacheer Kalvi 12th Business Maths Solutions Chapter 9 Applied Statistics Ex 9.2 24
Time reversal test is satisfied.

Factor Reversal Test:
Samacheer Kalvi 12th Business Maths Solutions Chapter 9 Applied Statistics Ex 9.2 25
Factor Reversal Test is satisfied.

Question 18.
Using Fisher’s Ideal Formula; compute price index number for 1999 with 1996 as the base year, given the following.
Samacheer Kalvi 12th Business Maths Solutions Chapter 9 Applied Statistics Ex 9.2 26
Solution:
Samacheer Kalvi 12th Business Maths Solutions Chapter 9 Applied Statistics Ex 9.2 27
Fisher’s index number
Samacheer Kalvi 12th Business Maths Solutions Chapter 9 Applied Statistics Ex 9.2 28
Thus we interpret that on an average, there is a decrease of 16.41 % in the price of commodities by Fisher’s Index number for the current year 1999 as compared to the base year 1996.

Samacheer Kalvi 12th Business Maths Solutions Chapter 9 Applied Statistics Ex 9.2

Question 19.
Calculate Fisher’s index number to the following data. Also, show that satisfies Time Reversal Test.
Samacheer Kalvi 12th Business Maths Solutions Chapter 9 Applied Statistics Ex 9.2 29
Solution:
Samacheer Kalvi 12th Business Maths Solutions Chapter 9 Applied Statistics Ex 9.2 30
Fisher’s price index number
Samacheer Kalvi 12th Business Maths Solutions Chapter 9 Applied Statistics Ex 9.2 31
On average, there is an increase of 22.3% in the price of commodities by Fisher’s Index number for the current year 2017 as compared to the base year 2016
Time reversal test:
To prove P01 × P10 = 1
Samacheer Kalvi 12th Business Maths Solutions Chapter 9 Applied Statistics Ex 9.2 32
Time reversal test is satisfied.

Question 20.
The following are the group index numbers and the group weights of an average working-class family’s budget. Construct the cost of living index number:
Samacheer Kalvi 12th Business Maths Solutions Chapter 9 Applied Statistics Ex 9.2 33
Solution:
Samacheer Kalvi 12th Business Maths Solutions Chapter 9 Applied Statistics Ex 9.2 34

Question 21.
Construct the cost of living Index number for 2015 on the basis of 2012 from the following data using the family budget method.
Samacheer Kalvi 12th Business Maths Solutions Chapter 9 Applied Statistics Ex 9.2 35
Solution:
Samacheer Kalvi 12th Business Maths Solutions Chapter 9 Applied Statistics Ex 9.2 36
Hence, the cost of living index number for a particular class of people for the year 2015 is increased by 17.31% as compared to the year 2012.

Samacheer Kalvi 12th Business Maths Solutions Chapter 9 Applied Statistics Ex 9.2

Question 22.
Calculate the cost of living index by aggregate expenditure method:
Samacheer Kalvi 12th Business Maths Solutions Chapter 9 Applied Statistics Ex 9.2 37
Solution:
Samacheer Kalvi 12th Business Maths Solutions Chapter 9 Applied Statistics Ex 9.2 38
Hence, the cost of living index number for a particular class of people for the year 2015 is increased by 30.62% as compared to the year 2010.

Samacheer Kalvi 12th Business Maths Solutions Chapter 9 Applied Statistics Ex 9.2 Read More »

Samacheer Kalvi 12th Business Maths Solutions Chapter 10 Operations Research Ex 10.1

Students can download 12th Business Maths Chapter 10 Operations Research Ex 10.1 Questions and Answers, Samacheer Kalvi 12th Business Maths Book Solutions Guide Pdf helps you to revise the complete Tamilnadu State Board New Syllabus and score more marks in your examinations.

Tamilnadu Samacheer Kalvi 12th Business Maths Solutions Chapter 10 Operations Research Ex 10.1

Question 1.
What is the transportation problem?
Solution:
The transportation problem deals with transporting goods from a source to a destination by minimum cost.
Description: A Manufacturer has a number of factories which produces goods at a fixed rate. He also has a number of warehouses, each of which has a fixed storage capacity. There is a cost to transport goods from a factory to a warehouse. Find the transportation of goods from factory to the warehouse that has the lowest possible cost.
Example:
Factories:
A1 makes 5 units
A2 makes 4 units
A3 makes 6 units
Warehouses:
b1 can store 5 units
b2 can store 3 units
b3 can store 5 units
b4 can store 2 units
Transportation costs:
Samacheer Kalvi 12th Business Maths Solutions Chapter 10 Operations Research Ex 10.1 1

Question 2.
Write the mathematical form of transportation problem.
Solution:
Mathematically a transportation problem is nothing but a special linear programming problem in which the objective function is to minimize the cost of transportation subjected to the demand and supply constraints.
Let there be ‘m’ sources of supply having ‘ai‘ units of supplies respectively to be transported among ‘n’ destinations with ‘bj‘ units of requirements respectively. Let Cij be the cost of shipping one unit of the commodity from source i to destination j for each route. Let xij be the units shipped per route.
Then the LPP is stated below.
Samacheer Kalvi 12th Business Maths Solutions Chapter 10 Operations Research Ex 10.1 2

Samacheer Kalvi 12th Business Maths Solutions Chapter 10 Operations Research Ex 10.1

Question 3.
What are a feasible solution and non-degenerate solution in the transportation problem?
Solution:
Feasible Solution: A feasible solution to a transportation problem is a set of non-negative values xij (i = 1, 2,.., m, j = 1, 2, …n) that satisfies the constraints.
Non-degenerate basic feasible Solution: If a basic feasible solution to a transportation problem contains exactly m + n – 1 allocation in independent positions, it is called a Non-degenerate basic feasible solution. Here m is the number of rows and n is the number of columns in a transportation problem.

Question 4.
What do you mean by balanced transportation problem?
Solution:
The balanced transportation problem is a transportation problem where the total availability at the origins is equal to the total requirements at the destinations.
Samacheer Kalvi 12th Business Maths Solutions Chapter 10 Operations Research Ex 10.1 3
A feasible solution can be obtained to these problems by Northwest comer method, minimum cost method (or) Vogel’s approximation method.

Samacheer Kalvi 12th Business Maths Solutions Chapter 10 Operations Research Ex 10.1

Question 5.
Find an initial basic feasible solution of the following problem using north-west corner rule.
Samacheer Kalvi 12th Business Maths Solutions Chapter 10 Operations Research Ex 10.1 4
Solution:
Given the transportation table is
Samacheer Kalvi 12th Business Maths Solutions Chapter 10 Operations Research Ex 10.1 5
Total supply = Total Demand = 90.
The given problem is a balanced transportation problem.
Hence there exists a feasible solution to the given problem.
First allocation:
Samacheer Kalvi 12th Business Maths Solutions Chapter 10 Operations Research Ex 10.1 6
Second allocation:
Samacheer Kalvi 12th Business Maths Solutions Chapter 10 Operations Research Ex 10.1 73
Third allocation:
Samacheer Kalvi 12th Business Maths Solutions Chapter 10 Operations Research Ex 10.1 7
Fourth allocation:
Samacheer Kalvi 12th Business Maths Solutions Chapter 10 Operations Research Ex 10.1 8
Fifth allocation:
Samacheer Kalvi 12th Business Maths Solutions Chapter 10 Operations Research Ex 10.1 9
Final allocation:
Samacheer Kalvi 12th Business Maths Solutions Chapter 10 Operations Research Ex 10.1 10
Transportation schedule:
O1 → D1, O1 → D2, O2 → D2, O2 → D3, O3 → D3, O3 → D4
(i.e) x11 = 16, x12 = 3, x22 = 15, x23 = 22, x33 = 9, x34 = 25.
Total transportation cost = (16 × 5) + (3 × 3) + (15 × 7) + (22 × 9) + (9 × 7) + (25 × 5)
= 80 + 9 + 105 + 198 + 63 + 125
= 580
Thus the minimum cost is Rs. 580 using the north west comer rule.

Samacheer Kalvi 12th Business Maths Solutions Chapter 10 Operations Research Ex 10.1

Question 6.
Determine an initial basic feasible solution of the following transportation problem by north-west corner method.
Samacheer Kalvi 12th Business Maths Solutions Chapter 10 Operations Research Ex 10.1 11
Solution:
Let B, N, Bh, D represent the destinations Bangalore, Nasik, Bhopal and Delhi respectively.
Let C, M, T represent the starting places Chennai, Madurai and Trichy respectively.
The given transportation table is
Samacheer Kalvi 12th Business Maths Solutions Chapter 10 Operations Research Ex 10.1 12
Total capacity = Total Demand = 120.
So the given problem is a balanced transportation problem.
Hence there exists a feasible solution to the given problem.
First allocation:
Samacheer Kalvi 12th Business Maths Solutions Chapter 10 Operations Research Ex 10.1 13
Second allocation:
Samacheer Kalvi 12th Business Maths Solutions Chapter 10 Operations Research Ex 10.1 14
Third allocation:
Samacheer Kalvi 12th Business Maths Solutions Chapter 10 Operations Research Ex 10.1 15
Fourth allocation:
Samacheer Kalvi 12th Business Maths Solutions Chapter 10 Operations Research Ex 10.1 16
Fifth allocation:
Samacheer Kalvi 12th Business Maths Solutions Chapter 10 Operations Research Ex 10.1 17
Final allocation:
Samacheer Kalvi 12th Business Maths Solutions Chapter 10 Operations Research Ex 10.1 18
Transportation schedule:
Chennai to Bangalore, Madurai to Bangalore, Madurai to Nasik, Madurai to Bhopal, Trichy to Bhopal, Trichy to Delhi.
(i.e) x11 = 30, x21 = 5, x22 = 28, x23 = 7, x33 = 25, x34 = 25
The total transportation cost = (30 × 6) + (5 × 5) + (28 × 11) + (7 × 9) + (25 × 7) + (25 × 13)
= 180 + 25 + 308 + 63 + 175 + 325
= 1076
Thus the minimum cost is Rs. 1076 by the north west comer method.

Question 7.
Obtain an initial basic feasible solution to the following transportation problem by using the least-cost method.
Samacheer Kalvi 12th Business Maths Solutions Chapter 10 Operations Research Ex 10.1 19
Solution:
Total supply = 25 + 35 + 40 = 100
Total demand = 30 + 25 + 45 = 100
Total supply = Total demand
∴ The given problem is a balanced transportation problem. Hence there exists a feasible solution to the given problem. Let ‘ai’ denote the supply and ‘bj’ denote the demand. We allocate the units according to the least transportation cost of each cell.
First allocation:
Samacheer Kalvi 12th Business Maths Solutions Chapter 10 Operations Research Ex 10.1 20
The least-cost 4 corresponds to cell (O2, D3). So first we allocate to this cell.
Second allocation:
Samacheer Kalvi 12th Business Maths Solutions Chapter 10 Operations Research Ex 10.1 21
The least-cost 5 corresponds to cell (O1, D3). So we have allocated min (10, 25) to this cell.
Third allocation:
Samacheer Kalvi 12th Business Maths Solutions Chapter 10 Operations Research Ex 10.1 22
The least-cost 6 corresponds to cell (O3, D2). So we have allocated min (25, 40) to this cell.
Fourth allocation:
Samacheer Kalvi 12th Business Maths Solutions Chapter 10 Operations Research Ex 10.1 23
The least-cost 7 corresponds to cell (O3, D1). So we have allocated min (30, 15) to this cell.
Final allocation:
Although the next least cost is 8, we cannot allocate to cells (O1, D2) and (O2, D2) because we have exhausted the demand 25 for this column. So we allocate 15 to cell (O1, D1)
Samacheer Kalvi 12th Business Maths Solutions Chapter 10 Operations Research Ex 10.1 24
Transportation schedule: O1 → D1, O1 → D3, O2 → D3, O3 → D1, O3 → D2
(i.e) x11 = 15, x13 = 10, x23 = 35, x31 = 15, x32 = 25
Total cost is = (15 × 9) + (10 × 5) + (35 × 4) + (15 × 7) + (25 × 6)
= 135 + 50 + 140 + 105 + 150
= 580
Thus by least cost method (LCM) the cost is Rs. 580.

Samacheer Kalvi 12th Business Maths Solutions Chapter 10 Operations Research Ex 10.1

Question 8.
Explain Vogel’s approximation method by obtaining an initial feasible solution of the following transportation problem
Samacheer Kalvi 12th Business Maths Solutions Chapter 10 Operations Research Ex 10.1 25
Solution:
Let ‘ai‘ denote the supply and ‘bj‘ denote the demand Σai = 6 + 1 + 10 = 17 and Σbj = 7 + 5 + 3 + 2 = 17
Σai = Σbj (i.e) Total supply = Total demand. the given problem is a balanced transportation problem. Hence there exists a feasible solution to the given problem.
First, we find the difference (penalty) between the first two smallest costs in each row and column and write them in brackets against the respective rows and columns.
First allocation:
Samacheer Kalvi 12th Business Maths Solutions Chapter 10 Operations Research Ex 10.1 26
The largest difference is 6 corresponding to column D4. In this column least cost is (O2, D4). Allocate min (2, 1) to this cell.
Second allocation:
Samacheer Kalvi 12th Business Maths Solutions Chapter 10 Operations Research Ex 10.1 27
The largest difference is 5 in column D2. Here the least cost is (O1, D2). So allocate min (5, 6) to this cell.
Third allocation:
Samacheer Kalvi 12th Business Maths Solutions Chapter 10 Operations Research Ex 10.1 28
The largest penalty is 5 in row O1. The least cost is in (O1, D1). So allocate min (7, 1) here.
Fourth allocation:
Samacheer Kalvi 12th Business Maths Solutions Chapter 10 Operations Research Ex 10.1 29
Fifth allocation:
Samacheer Kalvi 12th Business Maths Solutions Chapter 10 Operations Research Ex 10.1 30
We allocate min (1, 4) to (O3, D4) cell since it has the least cost. Finally the balance we allot to cell (O3, D3).
Thus we have the following allocations:
Samacheer Kalvi 12th Business Maths Solutions Chapter 10 Operations Research Ex 10.1 31
Transportation schedule:
O1 → D1, O1 → D2, O2 → D4, O3 → D1, O3 → D3, O3 → D4
(i.e) x11 = 12, x12 = 5, x24 = 1, x31 = 6, x33 = 3, x34 = 1
Total cost = (1 × 2) + (5 × 3) + (1 × 1) + (6 × 5) + (3 × 15) + (1 × 9)
= 2 + 15 + 1 + 30 + 45 + 9
= 102

Question 9.
Consider the following transportation problem.
Samacheer Kalvi 12th Business Maths Solutions Chapter 10 Operations Research Ex 10.1 32
Determine initial basic feasible solution by VAM
Solution:
Let ‘ai‘ denote the availability and ’bj‘ denote the requirement
Σai = 30 + 50 + 20 = 100 and Σbj = 30 + 40 + 20 + 10 = 100
Σai = Σbj So the given problem is a balanced transportation problem. Hence there exists a feasible solution to the given problem.
For VAM, we first find the penalties for rows and columns. We allocate units to the maximum penalty column (or) row with the least cost.
First allocation:
Samacheer Kalvi 12th Business Maths Solutions Chapter 10 Operations Research Ex 10.1 33
Largest penalty = 3. allocate min (40, 20) to (O3, D2)
Second allocation:
Samacheer Kalvi 12th Business Maths Solutions Chapter 10 Operations Research Ex 10.1 34
Largest penalty = 4. Allocate min (20, 30) to (O1, D3)
Third allocation:
Samacheer Kalvi 12th Business Maths Solutions Chapter 10 Operations Research Ex 10.1 35
The largest penalty is 3. Allocate min (20, 50) to (O2, D2)
Fourth allocation:
Samacheer Kalvi 12th Business Maths Solutions Chapter 10 Operations Research Ex 10.1 36
The largest penalty is 2, Allocate min (10, 30) to (O2, D4)
Fifth allocation:
Samacheer Kalvi 12th Business Maths Solutions Chapter 10 Operations Research Ex 10.1 37
The largest penalty is 1. Allocate min (30, 20) to (O2, D1)
Balance 10 units we allot to (O1, D1).
Thus we have the following allocations:
Samacheer Kalvi 12th Business Maths Solutions Chapter 10 Operations Research Ex 10.1 38
Transportation schedule:
O1 → D1, O1 → D3, O2 → D1, O2 → D2, O2 → D4, O3 → P2
(i.e) x11 = 10, x13 = 20, x21 = 20, x22 = 20, x24 = 10, x32 = 20
Total cost = (10 × 5) + (20 × 3) + (20 × 4) + (20 × 5) + (10 × 4) + (20 × 2)
= 50 + 60 + 80 + 100 + 40 + 40
= 370
Thus the least cost by YAM is Rs. 370.

Samacheer Kalvi 12th Business Maths Solutions Chapter 10 Operations Research Ex 10.1

Question 10.
Determine the basic feasible solution to the following transportation problem using North West Corner rule.
Samacheer Kalvi 12th Business Maths Solutions Chapter 10 Operations Research Ex 10.1 39
Solution:
For the given problem, total supply is 4 + 8 + 9 = 21 and total demand is 3 + 3 + 4 + 5 + 6 = 21.
Since the total supply equals total demand, it is a balanced problem and we can find a feasible solution by North West Comer rule.
First allocation:
Samacheer Kalvi 12th Business Maths Solutions Chapter 10 Operations Research Ex 10.1 40
Second allocation:
Samacheer Kalvi 12th Business Maths Solutions Chapter 10 Operations Research Ex 10.1 41
Third allocation:
Samacheer Kalvi 12th Business Maths Solutions Chapter 10 Operations Research Ex 10.1 42
Fourth allocation:
Samacheer Kalvi 12th Business Maths Solutions Chapter 10 Operations Research Ex 10.1 43
Fifth allocation:
Samacheer Kalvi 12th Business Maths Solutions Chapter 10 Operations Research Ex 10.1 44
Final allocation:
Samacheer Kalvi 12th Business Maths Solutions Chapter 10 Operations Research Ex 10.1 45
First, we allow 3 units to (R, D) cell. Then balance 6 to (R, E) cell.
Thus we have the following allocations:
Samacheer Kalvi 12th Business Maths Solutions Chapter 10 Operations Research Ex 10.1 46
Transportation schedule:
P → A, P → B, Q → B, Q → C, Q → D, R → D, R → E
(i.e) x11 = 3, x12 = 1, x22 = 2, x23 = 4, x24 = 2, x34 = 3, x35 = 6
Total cost = (3 × 2) + (1 × 11) + (2 × 4) + (4 × 7) + (2 × 2) + (3 × 8) + (6 × 12)
= 6 + 11 + 8 + 28 + 4 + 24 + 72
= 153
Thus the minimum cost of the transportation problem by Northwest Comer rule is Rs. 153.

Samacheer Kalvi 12th Business Maths Solutions Chapter 10 Operations Research Ex 10.1

Question 11.
Find the initial basic feasible solution of the following transportation problem:
Samacheer Kalvi 12th Business Maths Solutions Chapter 10 Operations Research Ex 10.1 47
Using (i) North West Corner rule
(ii) Least Cost method
(iii) Vogel’s approximation method
Solution:
Total demand (ai) = 7 + 12 + 11 = 30 and total supply (bj) = 10 + 10 + 10 = 30.
Σai = Σbj ⇒ the problem is a balanced transportation problem and we can find a basic feasible solution.
(i) North West Comer rule (NWC)
First allocation:
Samacheer Kalvi 12th Business Maths Solutions Chapter 10 Operations Research Ex 10.1 48
Second allocation:
Samacheer Kalvi 12th Business Maths Solutions Chapter 10 Operations Research Ex 10.1 49
Third allocation:
Samacheer Kalvi 12th Business Maths Solutions Chapter 10 Operations Research Ex 10.1 50
Fourth allocation:
Samacheer Kalvi 12th Business Maths Solutions Chapter 10 Operations Research Ex 10.1 51
We first allot 1 unit to (C, II) cell and then the balance 10 units to (C, III) cell.
Thus we have the following allocations:
Samacheer Kalvi 12th Business Maths Solutions Chapter 10 Operations Research Ex 10.1 52
Transportation schedule:
A → I, B → I, B → II, C → II, C → III
(i.e) x11 = 7, x21 = 3, x22 = 9, x32 = 1, x33 = 10
Total cost = (7 × 1) + (3 × 0) + (9 × 4) + (1 × 1) + (10 × 5)
= 7 + 0 + 36 + 1 + 50
= Rs. 94

(ii) Least Cost method
First allocation:
Samacheer Kalvi 12th Business Maths Solutions Chapter 10 Operations Research Ex 10.1 53
Second allocation:
Samacheer Kalvi 12th Business Maths Solutions Chapter 10 Operations Research Ex 10.1 54
Third allocation:
Samacheer Kalvi 12th Business Maths Solutions Chapter 10 Operations Research Ex 10.1 55
Fourth allocation:
Samacheer Kalvi 12th Business Maths Solutions Chapter 10 Operations Research Ex 10.1 56
We first allot 1 unit to cell (C, III) and the balance 7 units to cell (A, III).
Thus we have the following allocations:
Samacheer Kalvi 12th Business Maths Solutions Chapter 10 Operations Research Ex 10.1 57
Transportation schedule:
A → III, B → I, B → III, C → II, C → III
(i.e) x13 = 7, x21 = 10, x23 = 2, x32 = 10, x33 = 1
Total cost = (7 × 6) + (10 × 0) + (2 × 2) + (10 × 1) + (1 × 5)
= 42 + 0 + 4 + 10 + 5
= Rs. 61

(iii) Vogel’s approximation method (VAM)
First allocation:
Samacheer Kalvi 12th Business Maths Solutions Chapter 10 Operations Research Ex 10.1 58
Largest penalty = 3. Allocate min (10, 12) to (B, III)
Second allocation:
Samacheer Kalvi 12th Business Maths Solutions Chapter 10 Operations Research Ex 10.1 59
Largest penalty = 4. Allocate min (10, 2) to cell (B, I)
Third allocation:
Samacheer Kalvi 12th Business Maths Solutions Chapter 10 Operations Research Ex 10.1 60
The largest penalty is 2. We can choose I column or C row. Allocate min (8, 7) to cell (A, I)
Fourth allocation:
Samacheer Kalvi 12th Business Maths Solutions Chapter 10 Operations Research Ex 10.1 61
First, we allocate 10 units to cell (C, II). Then balance 1 unit we allot to cell (C, I)
Thus we have the following allocations:
Samaacheer Kalvi 12th Business Maths Solutions Chapter 10 Operations Research Ex 10.1 62
TYansportation schedule:
A → I, B → I, B → III, C → I, C → II
(i.e) x11 = 7, x21 = 2, x23 = 10, x31 = 1, x32 = 10
Total cost = (7 × 1) + (2 × 0) + (10 × 2) + (1 × 3) + (10 × 1)
= 7 + 0 + 20 + 3 + 10
= Rs. 40

Samacheer Kalvi 12th Business Maths Solutions Chapter 10 Operations Research Ex 10.1

Question 12.
Obtain an initial basic feasible solution to the following transportation problem by north-west corner method.
Samaacheer Kalvi 12th Business Maths Solutions Chapter 10 Operations Research Ex 10.1 63
Solution:
Total availability is 250 + 300 + 400 = 950
Total requirement is 200 + 225 + 275 + 250 = 950
Since Σai = Σbj the problem is a balanced transportation problem and we can find an initial basic feasible solution.
First Allocation:
Samaacheer Kalvi 12th Business Maths Solutions Chapter 10 Operations Research Ex 10.1 64
Second allocation:
Samaacheer Kalvi 12th Business Maths Solutions Chapter 10 Operations Research Ex 10.1 65
Third allocation:
Samaacheer Kalvi 12th Business Maths Solutions Chapter 10 Operations Research Ex 10.1 66
Fourth allocation:
Samaacheer Kalvi 12th Business Maths Solutions Chapter 10 Operations Research Ex 10.1 67
Fifth allocation:
Samaacheer Kalvi 12th Business Maths Solutions Chapter 10 Operations Research Ex 10.1 68
We first allocate 150 units to cell (C, F). Then we allocate balance of 250 units to cell (C, G)
Thus we have the following allocation.
Samaacheer Kalvi 12th Business Maths Solutions Chapter 10 Operations Research Ex 10.1 69
Transportation schedule:
A → D, A → E, B → E, B → F, C → F, C → G
(i.e) x11 = 200, x12 = 50, x22 = 175, x23 = 125, x33 = 150, x34 = 250
Total cost = (200 × 11) + (50 × 13) + (175 × 18) + (125 × 14) + (150 × 13) + (250 × 10)
= 2200 + 650 + 3150 + 1750 + 1950 + 2500
= Rs. 12,200

Samacheer Kalvi 12th Business Maths Solutions Chapter 10 Operations Research Ex 10.1 Read More »

Samacheer Kalvi 12th Business Maths Solutions Chapter 1 Applications of Matrices and Determinants Miscellaneous Problems

Students can download 12th Business Maths Chapter 1 Applications of Matrices and Determinants Miscellaneous Problems Questions and Answers, Samacheer Kalvi 12th Business Maths Book Solutions Guide Pdf helps you to revise the complete Tamilnadu State Board New Syllabus and score more marks in your examinations.

Tamilnadu Samacheer Kalvi 12th Business Maths Solutions Chapter 1 Applications of Matrices and Determinants Miscellaneous Problems

Question 1.
Find the rank of the matrix A = \(\left(\begin{array}{rrrr}
1 & -3 & 4 & 7 \\
9 & 1 & 2 & 0
\end{array}\right)\)
Solution:
A = \(\left(\begin{array}{rrrr}
1 & -3 & 4 & 7 \\
9 & 1 & 2 & 0
\end{array}\right)\)
Order of A is 2 × 4. So ρ(A) ≤ 2
Consider the second order minor
\(\left|\begin{array}{cc}
1 & -3 \\
9 & 1
\end{array}\right|\) = 1 + 27 = 28 ≠ 0
There is a minor of order 2 which is not zero.
So ρ(A) = 2

Question 2.
Find the rank of the matrix A = \(\left(\begin{array}{rrrr}
-2 & 1 & 3 & 4 \\
0 & 1 & 1 & 2 \\
1 & 3 & 4 & 7
\end{array}\right)\)
Solution:
Given A = \(\left(\begin{array}{rrrr}
-2 & 1 & 3 & 4 \\
0 & 1 & 1 & 2 \\
1 & 3 & 4 & 7
\end{array}\right)\)
Order of A is 3 × 4. So ρ(A) ≤ 3
Consider the third order minor
\(\left|\begin{array}{ccc}
-2 & 1 & 3 \\
0 & 1 & 1 \\
1 & 3 & 4
\end{array}\right|\)
= -2(4 – 3) – 1(0 – 1) + 3(0 – 1)
= -2 + 1 – 3 =
= -4 ≠ 0
There exists a minor of order 3 which is not zero. So ρ(A) = 3

Question 3.
Find the rank of the matrix A = \(\left(\begin{array}{llll}
4 & 5 & 2 & 2 \\
3 & 2 & 1 & 6 \\
4 & 4 & 8 & 0
\end{array}\right)\)
Solution:
Given A = \(\left(\begin{array}{llll}
4 & 5 & 2 & 2 \\
3 & 2 & 1 & 6 \\
4 & 4 & 8 & 0
\end{array}\right)\)
Order of A is 3 × 4. So ρ(A) ≤ 3
Consider the third order minor,
\(\left|\begin{array}{lll}
4 & 5 & 2 \\
3 & 2 & 1 \\
4 & 4 & 8
\end{array}\right|\)
= 4(16 – 4) – 5(24 – 4) + 2 (12 – 8)
= 48 – 100 + 8
= -44 ≠ 0
There is a minor of order 3 which is not zero.
ρ(A) = 3

Question 4.
Examine the consistency of the system of equations:
x + y + z = 7, x + 2y + 3z = 18, y + 2z = 6
Solution:
The given system is x + y + z = 7 , x + 2y + 3z = 18, y + 2z = 6.
The matrix equation corresponding to the given system
Samacheer Kalvi 12th Business Maths Solutions Chapter 1 Applications of Matrices and Determinants Miscellaneous Problems 1
Samacheer Kalvi 12th Business Maths Solutions Chapter 1 Applications of Matrices and Determinants Miscellaneous Problems 2
The last equivalent matrix is in the echelon form. [A, B] has 3 non-zero rows and [A] has 2 non- zero rows.
ρ([A, B]) = 3, ρ(A) = 2
ρ(A) ≠ ρ([A, B])
Hence the given system is inconsistent and has no solution.

Question 5.
Find k if the equations 2x + 3y – z = 5, 3x – y + 4z = 2, x + 7y – 6z = k are consistent.
Solution:
The given system is 2x + 3y – z = 5, 3x – y + 4z = 2, x + 7y – 6z = k
It is also given that the system is consistent.
The matrix equation corresponding to the given system is
Samacheer Kalvi 12th Business Maths Solutions Chapter 1 Applications of Matrices and Determinants Miscellaneous Problems 3
ρ(A) = 2; ρ([A, B]) = 2 or 3
For the equations to be consistent, ρ([A, B]) = ρ(A) = 2
k – 8 = 0 ⇒ k = 8

Question 6.
Find k if the equations x + y + z = 1, 3x – y – z = 4, x + 5y + 5z = k are inconsistent.
Solution:
The given system is x + y + z = 1, 3x – y – z = 4, x + 5y + 5z = k and it is inconsistent.
The matrix equation corresponding to the given system is
Samacheer Kalvi 12th Business Maths Solutions Chapter 1 Applications of Matrices and Determinants Miscellaneous Problems 4
ρ(A) = 2, since the equivalent matrix has 2 non zero rows.
For the equations to be inconsistent
ρ([A, B]) ≠ ρ(A)
ρ([A, B]) ≠ 2 ⇒ k ≠ 0
So k can assume any real value other than 0.

Question 7.
Solve the equations x + 2y + z = 7, 2x – y + 2z = 4, x + y – 2z = -1 by using Cramer’s rule.
Solution:
The given system is x + 2y + z = 7, 2x – y + 2z = 4, x + y – 2z = -1
Here ∆ = \(\left|\begin{array}{ccc}
1 & 2 & 1 \\
2 & -1 & 2 \\
1 & 1 & -2
\end{array}\right|\)
= 1(2 – 2) -2(4 – 2) + 1(2 + 1)
= 12 + 3
= 15 ≠ 0
We can apply Cramer’s ruleand the system is consistent and it has unique solution.
Samacheer Kalvi 12th Business Maths Solutions Chapter 1 Applications of Matrices and Determinants Miscellaneous Problems 5
Samacheer Kalvi 12th Business Maths Solutions Chapter 1 Applications of Matrices and Determinants Miscellaneous Problems 6

Question 8.
The cost of 2kg. of wheat and 1kg. of sugar is ₹ 100. The cost of 1kg. of wheat and 1kg. of rice is ₹ 80. The cost of 3kg. of wheat, 2kg. of sugar and 1kg of rice is ₹ 220. Find the cost of each per kg., using Cramer’s rule.
Solution:
Let the cost of wheat per kg be ₹ x, cost of sugar per kg be ₹ y and cost of rice per kg be ₹ z, respectively.
It is given that 2x + y = 100, x + z = 80, 3x + 2y + z = 220
Here ∆ = \(\left|\begin{array}{lll}
2 & 1 & 0 \\
1 & 0 & 1 \\
3 & 2 & 1
\end{array}\right|\)
= 2 (-2) – 1(-2 )
= -2 ≠ 0
we can apply Cramer’s rule and the system is consistent and its has unique solution.
Samacheer Kalvi 12th Business Maths Solutions Chapter 1 Applications of Matrices and Determinants Miscellaneous Problems 7
Hence the cost of wheat is ₹ 30/kg, cost of sugar is ₹ 40/kg and the cost of rice is ₹ 50/kg.

Question 9.
A salesman has the following record of sales for three months for three items A,B and C, which have different rates of commission.
Samacheer Kalvi 12th Business Maths Solutions Chapter 1 Applications of Matrices and Determinants Miscellaneous Problems 8
Find out the rate of commission on items A, B, and C by using Cramer’s rule.
Solution:
Let the rate of commission on items A, B, and C be ₹ x, ₹ y, and ₹ z per unit respectively.
According to the problem we have,
January, 90x + 100y + 20z = 800
February, 130x + 50y + 40z = 900
March, 60x + 100y + 30z = 850
Samacheer Kalvi 12th Business Maths Solutions Chapter 1 Applications of Matrices and Determinants Miscellaneous Problems 9
Samacheer Kalvi 12th Business Maths Solutions Chapter 1 Applications of Matrices and Determinants Miscellaneous Problems 10

Question 10.
The subscription department of a magazine sends out a letter to a large mailing list inviting subscriptions for the magazine. Some of the people receiving this letter already subscribe to the magazine while others do not. From this mailing list, 60% of those who already subscribe will subscribe again while 25% of those who do not now subscribe will subscribe. In the last letter, it was found that 40% of those receiving it ordered a subscription. What percent of those receiving the current letter can be expected to order a subscription?
Solution:
Let X represent people who subscribe for the magazine and Y represent people who do not subscribe to the magazine. Then
(X X) ⇒ those who already subscribed will do it again.
(X Y) ⇒ those who already subscribed will not do it again.
(Y X) ⇒ those who have not subscribed will do it now.
(Y Y) ⇒ those who have not subscribed already will not do it now also.
From the question,
Samacheer Kalvi 12th Business Maths Solutions Chapter 1 Applications of Matrices and Determinants Miscellaneous Problems 11
Samacheer Kalvi 12th Business Maths Solutions Chapter 1 Applications of Matrices and Determinants Miscellaneous Problems 12
Thus 39% of those receiving the current letter can be expected to order a subscription.

Samacheer Kalvi 12th Business Maths Solutions Chapter 1 Applications of Matrices and Determinants Miscellaneous Problems Read More »

Samacheer Kalvi 12th Business Maths Solutions Chapter 4 Differential Equations Miscellaneous Problems

Students can download 12th Business Maths Chapter 4 Differential Equations Miscellaneous Problems and Answers, Samacheer Kalvi 12th Business Maths Book Solutions Guide Pdf helps you to revise the complete Tamilnadu State Board New Syllabus and score more marks in your examinations.

Tamilnadu Samacheer Kalvi 12th Business Maths Solutions Chapter 4 Differential Equations Miscellaneous Problems

Question 1.
Suppose that Qd = 30 – 5P + 2 \(\frac{d p}{d t}+\frac{d^{2} p}{d t^{2}}\) and Qs = 6 + 3P. Find the equilibrium price for market clearance.
Solution:
For equilibrium price Qd = Qs
Samacheer Kalvi 12th Business Maths Solutions Chapter 4 Differential Equations Miscellaneous Problems Q1
Samacheer Kalvi 12th Business Maths Solutions Chapter 4 Differential Equations Miscellaneous Problems Q1.1

Question 2.
Form the differential equation having for its general solution y = ax2 + bx
Solution:
Given y = ax2 + bx
Since there are 2 constants a, b we have to differentiate twice to eliminate them
Samacheer Kalvi 12th Business Maths Solutions Chapter 4 Differential Equations Miscellaneous Problems Q2
Samacheer Kalvi 12th Business Maths Solutions Chapter 4 Differential Equations Miscellaneous Problems Q2.1

Question 3.
Solve yx2 dx + e-x dy = 0
Solution:
The given equation can be written as
Samacheer Kalvi 12th Business Maths Solutions Chapter 4 Differential Equations Miscellaneous Problems Q3

Question 4.
Solve: (x2 + y2) dx + 2xy dy = 0
Solution:
The given equation can be written as \(\frac{d y}{d x}=-\frac{\left(x^{2}+y^{2}\right)}{2 x y}\)
It is a homogeneous differential equation
Samacheer Kalvi 12th Business Maths Solutions Chapter 4 Differential Equations Miscellaneous Problems Q4
Samacheer Kalvi 12th Business Maths Solutions Chapter 4 Differential Equations Miscellaneous Problems Q4.1
Samacheer Kalvi 12th Business Maths Solutions Chapter 4 Differential Equations Miscellaneous Problems Q4.2

Question 5.
Solve: x \(\frac{d y}{d x}\) + 2y = x4
Solution:
Samacheer Kalvi 12th Business Maths Solutions Chapter 4 Differential Equations Miscellaneous Problems Q5

Question 6.
A manufacturing company has found that the cost C of operating and maintaining the equipment is related to the length ‘m’ of intervals between overhauls by the equation \(m^{2} \frac{d C}{d m}\) + 2mC = 2 and c = 4 and when m = 2. Find the relationship between C and m.
Solution:
Samacheer Kalvi 12th Business Maths Solutions Chapter 4 Differential Equations Miscellaneous Problems Q6
given that c = 4 when m = 2
4(4) = 2(2) + k
k = 12
So the relation ship between C and m is Cm2 = 2m + 12 = 2(m + 6)

Question 7.
Solve (D2 – 3D + 2)y = e4x given y = 0 when x = 0 and x = 1.
Solution:
(D2 – 3D + 2)y = e4x
The auxiliary equations is m2 – 3m + 2 = 0
(m – 2) (m – 1) = 0
m = 2, 1
Samacheer Kalvi 12th Business Maths Solutions Chapter 4 Differential Equations Miscellaneous Problems Q7
Samacheer Kalvi 12th Business Maths Solutions Chapter 4 Differential Equations Miscellaneous Problems Q7.1
Samacheer Kalvi 12th Business Maths Solutions Chapter 4 Differential Equations Miscellaneous Problems Q7.2

Question 8.
Solve: \(\frac{d y}{d x}\) + y cos x = 2cos x
Solution:
The given equation can be written as \(\frac{d y}{d x}\) + (cos x)y = 2 cos x
It is of the form \(\frac{d y}{d x}\) + Py = Q
Where P = cos x, Q = 2 cos x
Now ∫Pdx = ∫cos x dx = sin x
Samacheer Kalvi 12th Business Maths Solutions Chapter 4 Differential Equations Miscellaneous Problems Q8

Question 9.
Solve: x2y dx – (x3 + y3) dy = 0
Solution:
Samacheer Kalvi 12th Business Maths Solutions Chapter 4 Differential Equations Miscellaneous Problems Q9
Samacheer Kalvi 12th Business Maths Solutions Chapter 4 Differential Equations Miscellaneous Problems Q9.1

Question 10.
Solve: \(\frac{d y}{d x}\) = xy + x + y + 1
Solution:
Samacheer Kalvi 12th Business Maths Solutions Chapter 4 Differential Equations Miscellaneous Problems Q10

Samacheer Kalvi 12th Business Maths Solutions Chapter 4 Differential Equations Miscellaneous Problems Read More »

Samacheer Kalvi 12th Business Maths Solutions Chapter 6 Random Variable and Mathematical Expectation Miscellaneous Problems

Students can download 12th Business Maths Chapter 6 Random Variable and Mathematical Expectation Miscellaneous Problems and Answers, Samacheer Kalvi 12th Business Maths Book Solutions Guide Pdf helps you to revise the complete Tamilnadu State Board New Syllabus and score more marks in your examinations.

Tamilnadu Samacheer Kalvi 12th Business Maths Solutions Chapter 6 Random Variable and Mathematical Expectation Miscellaneous Problems

Question 1.
The probability function of a random variable X is given by
Samacheer Kalvi 12th Business Maths Solutions Chapter 6 Random Variable and Mathematical Expectation Miscellaneous Problems Q1
Evaluate the following probabilities.
(i) P(X ≤ 0)
(ii) P(X < 0)
(iii) P(|X| ≤ 2)
(iv) P(0 ≤ X ≤ 10)
Solution:
(i) P(X ≤ 0) = P (X = 0) + P (X = -2)
\(=\frac{1}{4}+\frac{1}{4}=\frac{1}{2}\)
(ii) P(X < 0) = P (X = – 2) = \(\frac{1}{4}\)
(iii) P(|X| ≤ 2) = P(-2 ≤ X ≤ 2)
= P(X = -2) + P(X = -1) + P(X = 0) + P(X = 1) + P(X = 2)
= \(\frac{1}{4}\) + 0 + \(\frac{1}{4}\) + 0 + 0
= \(\frac{1}{2}\)
(iv) P(0 ≤ X ≤ 10) = P(X = 0) + P(X = 10) + 0
\(=\frac{1}{4}+\frac{1}{2}=\frac{3}{4}\)

Question 2.
Let X be a random variable with cumulative distribution function.
Samacheer Kalvi 12th Business Maths Solutions Chapter 6 Random Variable and Mathematical Expectation Miscellaneous Problems Q2
(a) Compute: (i) P(1 ≤ X ≤ 2) and (ii) P(X = 3).
(b) Is X a discrete random variable? Justify your answer.
Solution:
(a) (i) P(1 ≤ X ≤ 2) = F(2) – F(1)
Samacheer Kalvi 12th Business Maths Solutions Chapter 6 Random Variable and Mathematical Expectation Miscellaneous Problems Q2.1
(a) (ii) P(X = 3) = 0. The given random variable is continuous r.v.
Hence the probability for a particular value of X is zero.
(b) X is not discrete since the cumulative distribution function is a continuous function. It is not a step function.

Samacheer Kalvi 12th Business Maths Solutions Chapter 6 Random Variable and Mathematical Expectation Miscellaneous Problems

Question 3.
The p.d.f. of X is defined as
Samacheer Kalvi 12th Business Maths Solutions Chapter 6 Random Variable and Mathematical Expectation Miscellaneous Problems Q3
Find the value of k and also find P(2 ≤ X ≤ 4).
Solution:
Samacheer Kalvi 12th Business Maths Solutions Chapter 6 Random Variable and Mathematical Expectation Miscellaneous Problems Q3.1
Samacheer Kalvi 12th Business Maths Solutions Chapter 6 Random Variable and Mathematical Expectation Miscellaneous Problems Q3.2

Question 4.
The probability distribution function of a discrete random variable X is
Samacheer Kalvi 12th Business Maths Solutions Chapter 6 Random Variable and Mathematical Expectation Miscellaneous Problems Q4
where k is some constant.
Find (a) k and (b) P(X > 2).
Solution:
(a) Given X is a discrete random variable.
The probability distribution can be written as
Samacheer Kalvi 12th Business Maths Solutions Chapter 6 Random Variable and Mathematical Expectation Miscellaneous Problems Q4.1
We know that Σp(x) = 1
⇒ 2k + 3k + 4k = 1
⇒ 9k = 1
⇒ k = 1/9
(b) P(X > 2) = P(X = 3) + P(X = 5)
= 3k + 4k
= 7k
= \(\frac{7}{9}\)

Samacheer Kalvi 12th Business Maths Solutions Chapter 6 Random Variable and Mathematical Expectation Miscellaneous Problems

Question 5.
The probability density function of a continuous random variable X is
Samacheer Kalvi 12th Business Maths Solutions Chapter 6 Random Variable and Mathematical Expectation Miscellaneous Problems Q5
where a and b are some constants.
Find (i) a and b if E(X) = \(\frac{3}{5}\)
(ii) Var(X)
Solution:
Given that X is a continuous random variable and f(x) is density function.
Samacheer Kalvi 12th Business Maths Solutions Chapter 6 Random Variable and Mathematical Expectation Miscellaneous Problems Q5.1
Samacheer Kalvi 12th Business Maths Solutions Chapter 6 Random Variable and Mathematical Expectation Miscellaneous Problems Q5.2
Samacheer Kalvi 12th Business Maths Solutions Chapter 6 Random Variable and Mathematical Expectation Miscellaneous Problems Q5.3
Samacheer Kalvi 12th Business Maths Solutions Chapter 6 Random Variable and Mathematical Expectation Miscellaneous Problems Q5.4

Question 6.
Prove that if E(X) = 0, then V(X) = E(X2).
Solution:
Given E(X) = 0. To show V(X) = E (X2)
We know that Var (X) = E(X2) – [E(X)]2
So if E(X) = 0, Var (X) = E(X2)
From the definition of the variance of X also we can see the result.
Var(X) = Σ[x – E(x)]2 p(x)
If E (X) = 0, then V(X) = Σ x2 p(x) = E(X2)

Samacheer Kalvi 12th Business Maths Solutions Chapter 6 Random Variable and Mathematical Expectation Miscellaneous Problems

Question 7.
What is the expected value of a game that works as follows: I flip a coin and if tails pay you ₹ 2; if heads pay you ₹ 1. In either case, I also pay you ₹ 50.
Solution:
Let X be the expected value of the game.
The probability distribution is given by,
Samacheer Kalvi 12th Business Maths Solutions Chapter 6 Random Variable and Mathematical Expectation Miscellaneous Problems Q7

Question 8.
Prove that
(i) V(aX) = a2 V(X)
(ii) V(X + b) = V(X)
Solution:
(i) To show V(aX) = a2 V(X)
We know V(X) = E(X2) – [E(X)]2
So V(aX) = [E(a2 X2)] – [E(aX)]2
= a2 E(X2) – [aE(X)]2
= a2 E(X2) – a2 [E(X)]2
= a2 {{E(X2) – [E(X)]2}
= a2 V(X)

(ii) V(X + b) = V(X)
LHS = V(X + b) = E[(X + b)2] – {E(X + b)}2
= E [X2 + 2bX + b2] – [E(X) + b]2
= E(X2) + 2bE(X) + b2 – [(E(X))2 + b2 + 2bE(X)]
= E(X2) + 2bE(X) + b2 – [E(X)]2 – b2 – 2bE(X)
= E(X2) – [E(X)]2
= V(X)
= RHS

Samacheer Kalvi 12th Business Maths Solutions Chapter 6 Random Variable and Mathematical Expectation Miscellaneous Problems

Question 9.
Consider a random variable X with p.d.f
Samacheer Kalvi 12th Business Maths Solutions Chapter 6 Random Variable and Mathematical Expectation Miscellaneous Problems Q9
Find E(X) and V(3X – 2).
Solution:
Samacheer Kalvi 12th Business Maths Solutions Chapter 6 Random Variable and Mathematical Expectation Miscellaneous Problems Q9.1
Samacheer Kalvi 12th Business Maths Solutions Chapter 6 Random Variable and Mathematical Expectation Miscellaneous Problems Q9.2

Samacheer Kalvi 12th Business Maths Solutions Chapter 6 Random Variable and Mathematical Expectation Miscellaneous Problems

Question 10.
The time to failure in thousands of hours of an important piece of electronic equipment used in a manufactured DVD player has the density function.
Samacheer Kalvi 12th Business Maths Solutions Chapter 6 Random Variable and Mathematical Expectation Miscellaneous Problems Q10
Find the expected life of this piece of equipment.
Solution:
Let X be the random variable denoting the life of the piece of equipment.
Samacheer Kalvi 12th Business Maths Solutions Chapter 6 Random Variable and Mathematical Expectation Miscellaneous Problems Q10.1
Thus the expected life of the piece of equipment is \(\frac{1}{2}\) hrs (in thousands).

Samacheer Kalvi 12th Business Maths Solutions Chapter 6 Random Variable and Mathematical Expectation Miscellaneous Problems Read More »

Samacheer Kalvi 12th Business Maths Solutions Chapter 5 Numerical Methods Miscellaneous Problems Q5.1

Samacheer Kalvi 12th Business Maths Solutions Chapter 5 Numerical Methods Miscellaneous Problems

Students can download 12th Business Maths Chapter 5 Numerical Methods Miscellaneous Problems and Answers, Samacheer Kalvi 12th Business Maths Book Solutions Guide Pdf helps you to revise the complete Tamilnadu State Board New Syllabus and score more marks in your examinations.

Tamilnadu Samacheer Kalvi 12th Business Maths Solutions Chapter 5 Numerical Methods Miscellaneous Problems

Question 1.
If f(x) = eax then show that f(0), ∆f(0), ∆2 f(0) are in G.P
Solution:
Samacheer Kalvi 12th Business Maths Solutions Chapter 5 Numerical Methods Miscellaneous Problems Q1

Question 2.
Prove that
(i) (1 + ∆) (1 – ∇) = 1
(ii) ∆∇ = ∆ – ∇
(iii) E∇ = ∆ – ∇E
Solution:
(i) To show (1 + ∆) (1 – ∇) = 1
Samacheer Kalvi 12th Business Maths Solutions Chapter 5 Numerical Methods Miscellaneous Problems Q2
Samacheer Kalvi 12th Business Maths Solutions Chapter 5 Numerical Methods Miscellaneous Problems Q2.1
Hence proved.

Samacheer Kalvi 12th Business Maths Solutions Chapter 5 Numerical Methods Miscellaneous Problems

Question 3.
A second degree polynomial passes through the point (1, -1) (2, -1) (3, 1) (4, 5). Find the polynomial.
Solution:
Given values can be tabulated as follows
Samacheer Kalvi 12th Business Maths Solutions Chapter 5 Numerical Methods Miscellaneous Problems Q3
We have to find a second-degree polynomial.
We use Newton’s forward interpolation formula
Samacheer Kalvi 12th Business Maths Solutions Chapter 5 Numerical Methods Miscellaneous Problems Q3.1
The difference table is given below
Samacheer Kalvi 12th Business Maths Solutions Chapter 5 Numerical Methods Miscellaneous Problems Q3.2
(or) y = x2 – 3x + 1 is the required second-degree polynomial which passes through the given points

Question 4.
Find the missing figures in the following table
Samacheer Kalvi 12th Business Maths Solutions Chapter 5 Numerical Methods Miscellaneous Problems Q4
Solution:
Since only four values of y are given, the polynomial which fits the data is of degree three.
Hence fourth differences are zero.
Samacheer Kalvi 12th Business Maths Solutions Chapter 5 Numerical Methods Miscellaneous Problems Q4.1
Samacheer Kalvi 12th Business Maths Solutions Chapter 5 Numerical Methods Miscellaneous Problems Q4.2
Thus the missing figures are 14.25 and 23.5

Samacheer Kalvi 12th Business Maths Solutions Chapter 5 Numerical Methods Miscellaneous Problems

Question 5.
Find f(0.5) if f(-1) = 202, f(0) = 175, f(1) = 82 and f(2) = 55
Solution:
The given data can be written as
Samacheer Kalvi 12th Business Maths Solutions Chapter 5 Numerical Methods Miscellaneous Problems Q5
We have to find y when x = 0.5.
We use Newton’s forward interpolation formula
Samacheer Kalvi 12th Business Maths Solutions Chapter 5 Numerical Methods Miscellaneous Problems Q5.1
The difference table is
Samacheer Kalvi 12th Business Maths Solutions Chapter 5 Numerical Methods Miscellaneous Problems Q5.2
Using these values we get,
Samacheer Kalvi 12th Business Maths Solutions Chapter 5 Numerical Methods Miscellaneous Problems Q5.3
Thus the value of f(0.5) = 128.5

Question 6.
From the following data find y at x = 43 and x = 84
Samacheer Kalvi 12th Business Maths Solutions Chapter 5 Numerical Methods Miscellaneous Problems Q6
Solution:
We have to find the value of y at (a) x = 43 and (b) x = 84
(a) x = 43.
The value of y is required at the beginning of the table.
So we use Newton’s forward interpolation formula
Samacheer Kalvi 12th Business Maths Solutions Chapter 5 Numerical Methods Miscellaneous Problems Q6.1
Here x = 43 , x0 = 40, h = 10
So 43 = 40 + 10n
n = 0.3
The difference table is given below
Samacheer Kalvi 12th Business Maths Solutions Chapter 5 Numerical Methods Miscellaneous Problems Q6.2
y = 184 + 6 – 0.21
y = 189.79

(b) x = 84.
The value of y is required at the end of the table.
So we use Newton’s backward interpolation formula
Samacheer Kalvi 12th Business Maths Solutions Chapter 5 Numerical Methods Miscellaneous Problems Q6.3
We use the back difference values from the table
Samacheer Kalvi 12th Business Maths Solutions Chapter 5 Numerical Methods Miscellaneous Problems Q6.4
Hence the value of y at x = 43 is 189.75 and the value of y at x = 84 is 286.96

Samacheer Kalvi 12th Business Maths Solutions Chapter 5 Numerical Methods Miscellaneous Problems

Question 7.
The area A of a circle of diameter ‘d’ is given for the following values
Samacheer Kalvi 12th Business Maths Solutions Chapter 5 Numerical Methods Miscellaneous Problems Q7
Find the approximate values for the areas of circles of diameter 82 and 91 respectively.
Solution:
Let diameter be x and area be y
We have to find value of y when (a) x = 82 and (b) x = 91
We first find the difference as given below
Samacheer Kalvi 12th Business Maths Solutions Chapter 5 Numerical Methods Miscellaneous Problems Q7.1
Samacheer Kalvi 12th Business Maths Solutions Chapter 5 Numerical Methods Miscellaneous Problems Q7.2
Samacheer Kalvi 12th Business Maths Solutions Chapter 5 Numerical Methods Miscellaneous Problems Q7.3
Hence the area of a circle when the diameter is 82 is 5281
area of a circle when the diameter is 91 is 6504.

Question 8.
If u0 = 560, u1 = 556, u2 = 520, u4 = 385, show that u3 = 465
Solution:
Given u0 = 560, u1 = 556, u2 = 520, u4 = 385
Since only four values are given,
Samacheer Kalvi 12th Business Maths Solutions Chapter 5 Numerical Methods Miscellaneous Problems Q8

Samacheer Kalvi 12th Business Maths Solutions Chapter 5 Numerical Methods Miscellaneous Problems

Question 9.
From the following table obtain a polynomial of degree y in x
Samacheer Kalvi 12th Business Maths Solutions Chapter 5 Numerical Methods Miscellaneous Problems Q9
Solution:
To find a polynomial y = f(x)
Here x0 = 1, h = 1
x = x0 + nh
x = 1 + n(1)
n = x – 1
We find the forward differences as below
Samacheer Kalvi 12th Business Maths Solutions Chapter 5 Numerical Methods Miscellaneous Problems Q9.1
Using Newton’s forward interpolation formula,
Samacheer Kalvi 12th Business Maths Solutions Chapter 5 Numerical Methods Miscellaneous Problems Q9.2
Samacheer Kalvi 12th Business Maths Solutions Chapter 5 Numerical Methods Miscellaneous Problems Q9.3

Question 10.
Using Lagrange’s interpolation formula find a polynomial which passes through the points (0, -12), (1, 0), (3, 6) and (4, 12).
Solution:
The given values are
x0 = 0, y0 = -12
x1 = 1, y1 = 0
x2 = 3, y2 = 6
x3 = 4, y3 = 12
Samacheer Kalvi 12th Business Maths Solutions Chapter 5 Numerical Methods Miscellaneous Problems Q10
By Lagrange’s interpolaiton formula,
Samacheer Kalvi 12th Business Maths Solutions Chapter 5 Numerical Methods Miscellaneous Problems Q10.1
⇒ y = (x – 1) (x – 3) (x – 4) – x (x – 1) (x – 4) + x (x – 1) (x – 3)
⇒ y = (x – 1) (x – 4)[(x – 3) – x] + x (x – 1) (x – 3)
⇒ y = (x – 1) (x – 4) (-3) + x (x – 1) (x – 3)
⇒ y = (x – 1) [-3x + 12 + x2 – 3x]
⇒ y = (x – 1) (x2 – 6x + 12)
⇒ y = x3 – 6x2 + 12x – x2 + 6x – 12
y = x3 – 7x2 + 18x – 12 is the required polynomial which passes through the given points

Samacheer Kalvi 12th Business Maths Solutions Chapter 5 Numerical Methods Miscellaneous Problems Read More »