Students can download 12th Business Maths Chapter 9 Applied Statistics Miscellaneous Problems and Answers, Samacheer Kalvi 12th Business Maths Book Solutions Guide Pdf helps you to revise the complete Tamilnadu State Board New Syllabus and score more marks in your examinations.
Tamilnadu Samacheer Kalvi 12th Business Maths Solutions Chapter 9 Applied Statistics Miscellaneous Problems
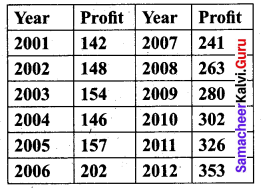
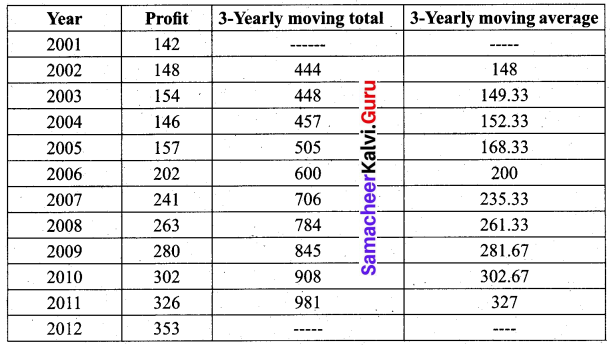
Question 1.
Using three yearly moving averages, Determine the trend values from the following data.
Solution:
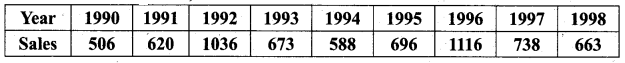
Question 2.
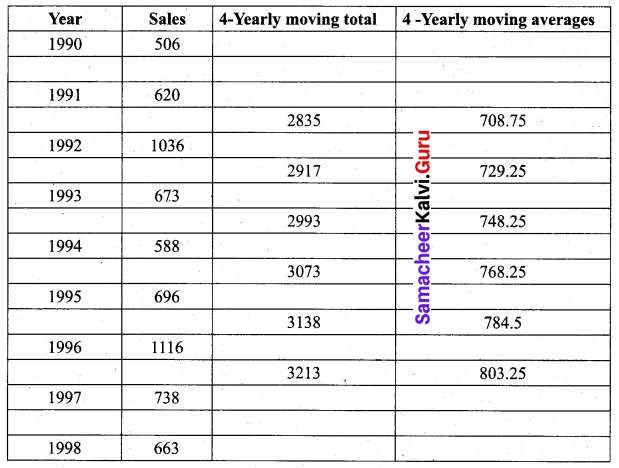
From the following data, calculate the trend values using fourly moving averages.
Solution:
![]()
Question 3.
Fit a straight line trend by the method of least squares to the following data.
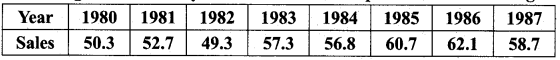
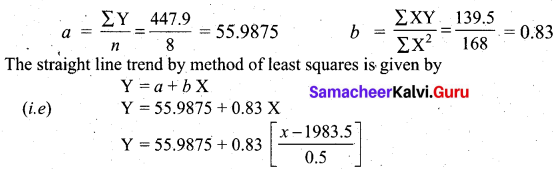
Solution:
Let x denote the years and y denote the sales. Since number of years is even,
we take X = \(\frac{x-1983.5}{0.5}\)
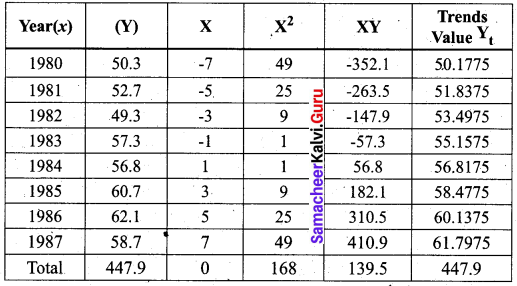
The trend values are obtained by substituting the years for x, and given in the table.
When x= 1980, Yt = 55.9875 + 0.83(-7) = 50.1775
When x = 1981, Yt = 55.9875 – 5(0.83) = 51.8375
When x = 1982, Yt = 55.9875 – 3(0.83) = 53.4975
When x= 1983, Yt = 55.9875 – (0.83) = 55.1575
When x = 1984, Yt = 55.9875 + (0.83) = 56.8175
When x = 1985, Yt = 55.9875 + 3(0.83) = 58.4775
When x = 1986, Yt = 55.9875 + 5(0.83) = 60.1375
When x = 1987, Yt = 55.9875 + 7(0.83) = 61.7975
We find that ΣYt = ΣY = 447.9
Question 4.
Calculate the Laspeyre’s, Paasche’s and Fisher’s price index number for the following data. Interpret the data.
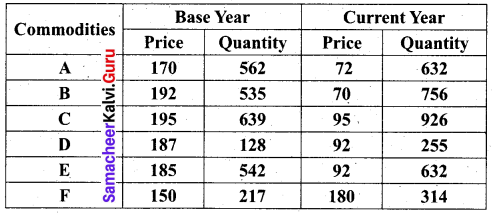
Solution:
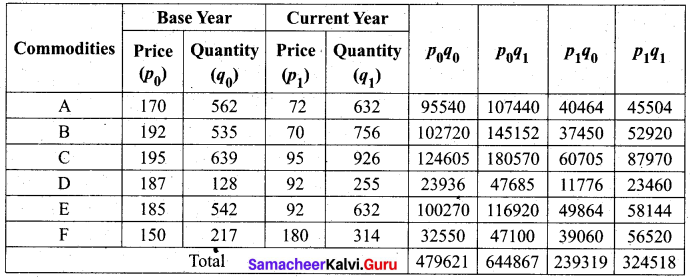
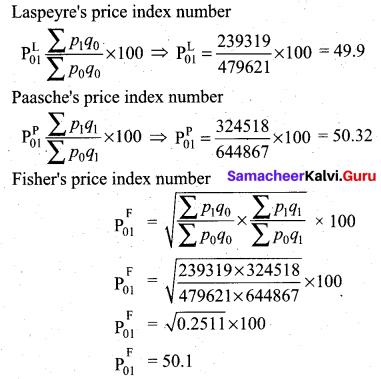
From the index numbers, we conclude that for the same quantity, the price has reduced by 50.5% in the current year compared to the base year according to Laspeyre’s index. By the Paasche’s index number, we see that the price has reduced by 49.68% in the current year, and according to Fisher’s index number it has reduced by 49.9% in the current year.
![]()
Question 5.
Using the following data, construct Fisher’s Ideal Index Number and show that it satisfies the Factor Reversal Test and Time Reversal Test?
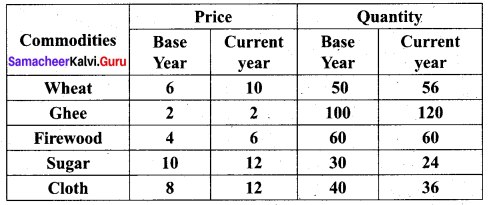
Solution:
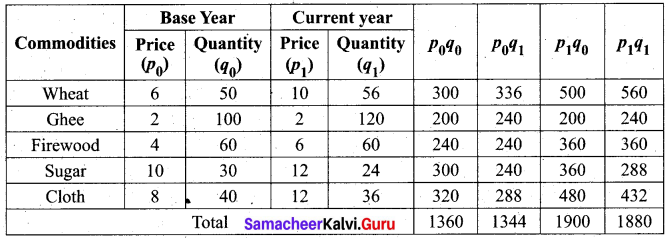
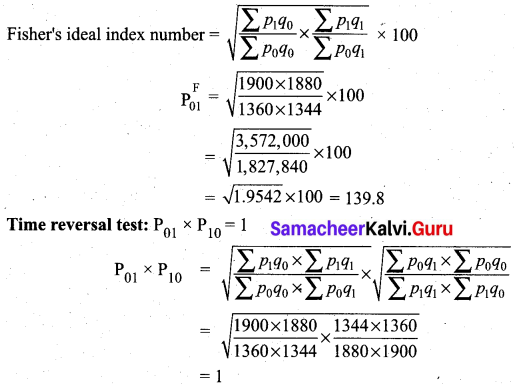
This shows Fisher’s ideal index number satisfies time reversal test.
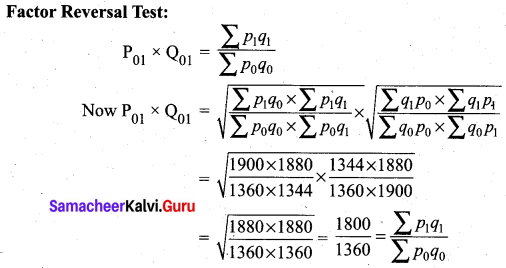
This shows Fisher’s ideal index number satisfies factor reversal test.
Question 6.
Compute the consumer price index for 2016 on the basis of 2015 from the following data.
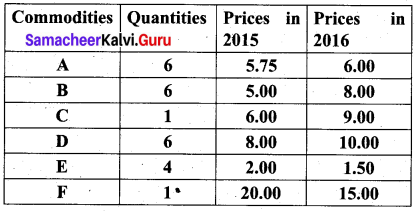
Solution:
Consumer price index (CPI) is same as cost of living index. We use the aggregate expenditure method which gives CPI as CPI = \(\frac{\sum p_{1} q_{0}}{\sum p_{0} q_{0}} \times 100\)
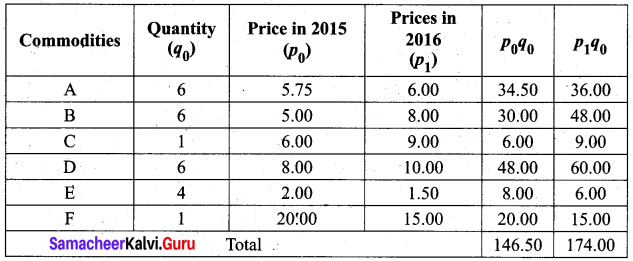
Consumer price index for the year 2016 is = \(\frac{174}{146.50} \times 100\) = 118.77
On the basis of the year 2015, The cost of living has increased by 18.77%
![]()
Question 7.
An Enquiry was made into the budgets of the middle-class families in a city gave the following information.
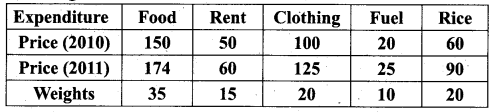
What changes in the cost of living have taken place in the middle-class families of a city?
Solution:
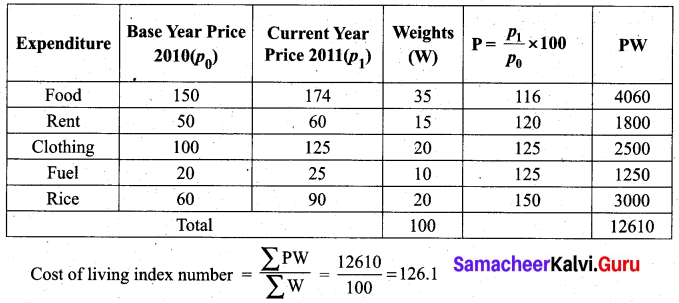
For the middle-class families of the city, the cost of living has increased up to 26.1 % in 2011 as compared to 2010.
Question 8.
From the following data, calculate the control limits for the mean and range chart.
Solution:
Since the sample size is 5, we used A2 = 0.577, D3 = 0, D4 = 2.114, from the table given.
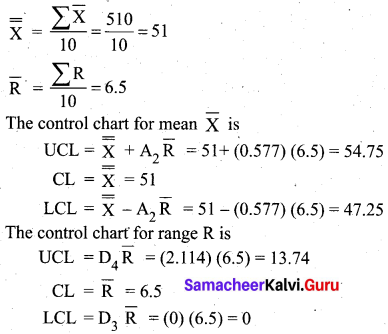
We see that one sample \(\bar{X}\) value 47 is below the LCL of \(\bar{X}\). To infer that the process is not totally out of control since^the difference is less. Further investigation is recommended.
![]()
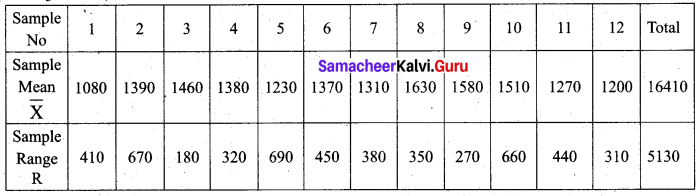
Question 9.
The following data gives the average life (in hours) and a range of 12 samples of 5 lamps each. The data are
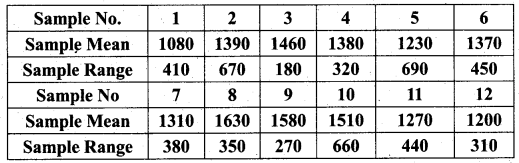
Construct control charts for mean and range. Comment on the control limits.
Solution:
In this question the number of observations is 5 for each sample. So we use A2 = 0.577, D3 = 0, D4 = 2.114 from the table of control chart constants.
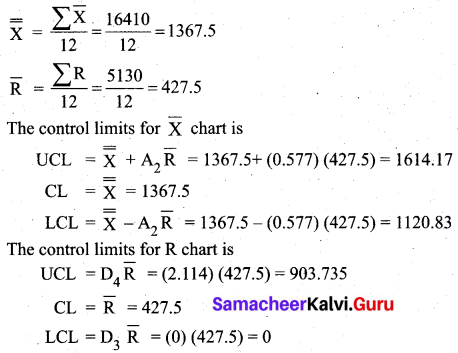
We observe that the sample \(\bar{X}\) value 1080 is below the LCL. All sample range values are within the control limits for R. We say that process is out of control.
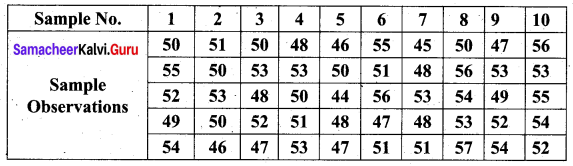
Question 10.
The following are the sample means and ranges for 10 samples, each of size 5. Calculate the control limits for the mean chart and range chart and state whether the process is in control or not.
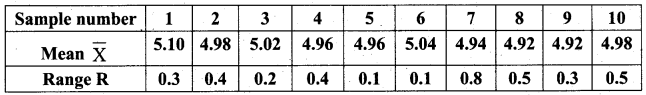
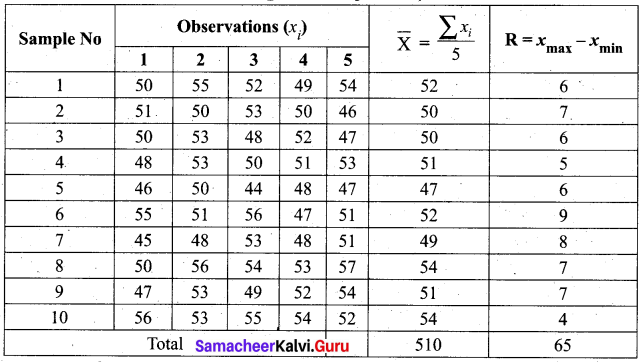
Solution:
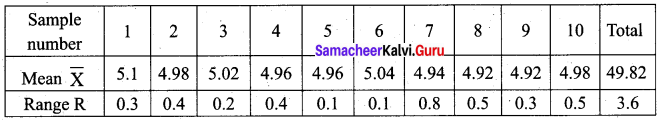
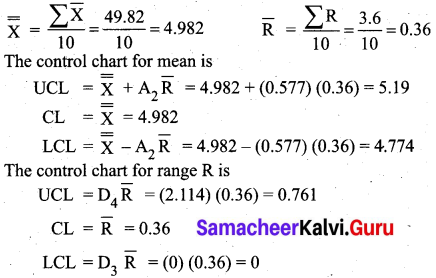
We observe that all sample \(\bar{X}\) values are within the control limits value of \(\bar{X}\) chart. But the sample range value 0.8 is above the UCL of the R chart. So we conclude that the process is out of control.