Students can download 12th Business Maths Chapter 8 Sampling Techniques and Statistical Inference Miscellaneous Problems and Answers, Samacheer Kalvi 12th Business Maths Book Solutions Guide Pdf helps you to revise the complete Tamilnadu State Board New Syllabus and score more marks in your examinations.
Tamilnadu Samacheer Kalvi 12th Business Maths Solutions Chapter 8 Sampling Techniques and Statistical Inference Miscellaneous Problems
Question 1.
Explain the types of sampling.
Solution:
The different types of sampling are
- simple random sampling
- Stratified random sampling and
- Systematic sampling
(i) In simple random sampling, every item of the population has an equal chance for being selected. The sampling can be done with replacement (or) without replacement. A random sampling from a finite population with replacement is equivalent to sampling from an infinite population without replacement. This technique will give useful results only if the population is homogeneous. The following are some of the methods of selecting a random sample.
(a) Use of an unbiased die or coin: If we have to choose between two alternatives, a coin is tossed and depending on the head or tail course of action is taken. A die can be employed if there are six different alternatives.
(b) Lottery sampling: Here a random sample is selected by identifying each element of the population by means of a card of a pack of uniform cards or (by writing the number on pieces of paper) and to select a required number of cards after thorough mixing of the cards.
(c) Random numbers: Random numbers are formed of ‘random digits’ and arranged in the form of a table having a number of rows and columns. Tippett’s numbers form one such table wherein 40,000 digits were selected at random from census reports and combined by groups of four into 10,000 numbers.
(ii) In stratified random sampling, a population of units is divided into L sub-populations of N1, N2, …… NL. The sub-populations being non-overlapping and mutually exhaustive so that N = N1 + N2 + …….. + NL. Each sub-populations is known as a stratum. If we select n1, n2, ……. nl items, respectively, from these strata, we get a stratified sample. If a simple random sample is taken from each stratum, the whole procedure is referred to as stratified random sampling.
![]()
(iii) Systematic sampling is a form of restricted random selection which is highly useful in surveys concerning enumerable population. In this method, every member of the population is numbered in serial order and every ith element, starting from any of the first items is chosen. For example, suppose we require a 5% sample of students from a college where there are 2000 students, we select a random number from 1 to 20. If it is 12, then our sample consists of students with numbers 12, 32, 52, 72, …… 1992.
Question 2.
Write a short note on sampling distribution and standard error.
Solution:
Sampling distribution: Sampling distribution of a statistic is the frequency distribution which is formed with various values of a statistic computed from different samples of the same size drawn from the same population.
For instance if we draw a sample of size n from a given finite population of size N, then the total number of possible samples is \(^{\mathrm{N}} C_{n}=\frac{\mathrm{N} !}{n !(N-n) !}=k\) (say). For each of these k samples we can compute some statistic, t = t(x1, x2, x3 ,… xn), in particular the mean \(\bar{X}\) the variance S2, etc., is given below
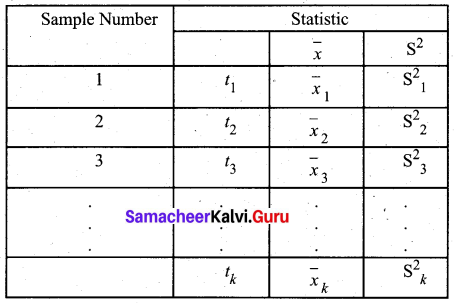
The set of the values of the statistic so obtained, one for each sample constitutes the sampling distribution of the statistic.
![]()
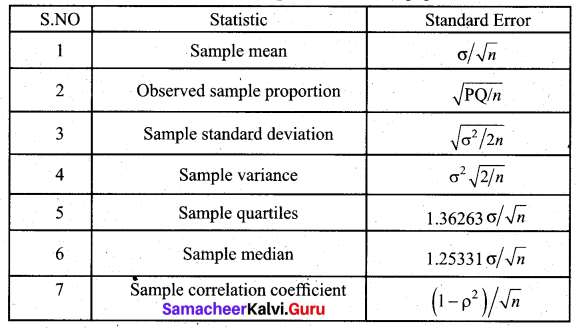
Standard Error:
The standard deviation of the sampling distribution of a statistic is known as its Standard Error abbreviated as S.E. The Standard Errors (S.E.) of some of the well-known statistics, for large samples, are given below, where n is the sample size, σ2 is the population variance.
Question 3.
Explain the procedures of testing of hypothesis.
Solution:
Hypothesis testing addresses the important question of how to choose among alternative propositions while controlling and minimizing the risk of wrong decisions. A hypothesis which is tested for possible rejection is called null hypothesis H0 and the hypothesis which is opposite to this is the alternative hypothesis H1. There are two basic types of decision problems that can be considered in a hypothesis testing procedure.
(a) whether a population parameter has changed from or differs from a particular value.
(b) whether the sample has come from the population that has a parameter value less than or more than the hypothesized value.
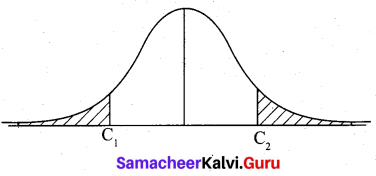
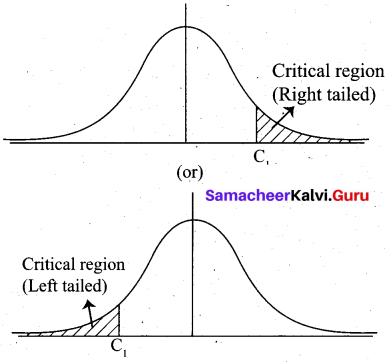
The set of all possible values of the sample statistic is referred to as the sample space. The test procedure divides the sample space into two parts called the acceptance region and rejection region (critical region). In the case of the two-tailed test, we find two values C1 and C2 which set the limits on the amount of sampling variation consistent with the null hypothesis H0. For the one-tailed test, we find only one value C1
When the hypothesis H0 is rejected when it is true the error is Type I error. When H0 is accepted when it is false it is called Type II error. When the calculated value of the test statistic is less than the table value, we accept the null hypothesis H0; otherwise, accept alternative hypothesis H1.
Question 4.
Explain in detail about the test of significance of a single mean.
Solution:
A random sample of size n (n ≥ 30) is drawn from a population. We want to test the population mean has a specified value µ0.
Procedure for testing: (For two-tail test)
The null hypothesis is H0 : µ = µ0.
The alternative hypothesis is H1 : µ ≠ µ2
Since n is large the sampling distribution of \(\bar{x}\) (the sample mean) is approximately normal.
The test statistic
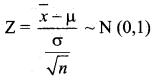
For a significance level α = 0.05 (5% level)
If |Z| < 1.96, H0 is accepted at 5% level. If |Z| > 1.96, H0 is rejected at 5% level
For α = 0.01 (1% level), if |Z| < 2.58, H0 is accepted. If |Z| > 2.58, H0 is rejected.
Procedure for one tail test: (left tail)
H0 : µ ≥ µ0
H1 : µ < µ0
At α = 0.05, |Z| = 1.645
If Z < -1.645, H0 is rejected If Z > -1.645, H0 is accepted
One tail test: (right tail)
If Z < 1.645, H0 is accepted If Z > 1.645, H0 is rejected at 5% level of significance.
![]()
Question 5.
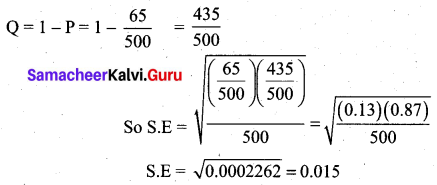
Determine the standard error of proportion for a random sample of 500 pineapples was taken from a large consignment and 65 were found to be bad.
Solution:
The standard error of proportion is S.E. = \(\sqrt{\mathrm{PQ} / \mathrm{n}}\)
Given sample size n = 500 and P = \(\frac{65}{500}\)
Question 6.
A sample of 100 students is drawn from a school. The mean weight and variance of the sample are 67.45 kg and 9 kg. respectively. Find (a) 95% (b) 99% confidence intervals for estimating the mean weight of the students.
Solution:
Given Sample size n = 100
Sample mean \(\bar{x}\) = 67.45 kg
Sample S.D s = √9 = 3 kg
(a) 95% confidence interval for population mean µ is,
![]()
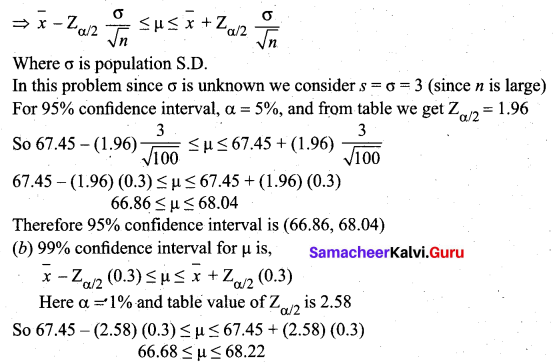
Therefore 99% confidence intervals for estimating the mean weight of the students is (66.68, 68.22)
![]()
Question 7.
The mean I.Q of a sample of 1600 children was 99. Is it likely that this was a random sample from a population with mean I.Q 100 and standard deviation 15? (Test at 5% level of significance)
Solution:
Given
n (Sample size) = 1600 children
\(\bar{x}\) (Sample mean) = 99
µ (Population mean) = 100
σ (Population SD) = 15
α (Level of significance) = 5%
Null hypothesis H0 : µ = 100
(Sample has been drawn from a population with mean 100 and S.D 15)
Alternative hypothesis H1 : µ ≠ 100
(Sample has not been taken from a population with mean 100 and S.D 15)
Test statistic
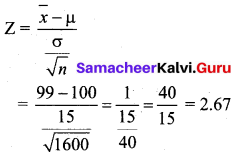
The significant value or table value \(Z_{\alpha / 2}\) = 1.96. Comparing the values, we see that 2.67 > 1.96 (or) Z > \(Z_{\alpha / 2}\) at 5% level of significance. So the null hypothesis is rejected. Hence we conclude that the random sample is not taken from a population with mean I.Q = 100 and S.D = 15.