Students can Download Social Science Geography Term 3 Chapter 3 Map Reading Questions and Answers, Notes Pdf, Samacheer Kalvi 8th Social Science Book Solutions Guide Pdf helps you to revise the complete Tamilnadu State Board New Syllabus and score more marks in your examinations.
Tamilnadu Samacheer Kalvi 8th Social Science Geography Solutions Term 3 Chapter 3 Map Reading
Samacheer Kalvi 8th Social Science Geography Map Reading Textual Evaluation
![]()
I. Choose the best answer:
Question 1.
The subject which deals with map making process is-
(a) Demography
(b) Cartography
(c) Physiography
(d) Topography
Answer:
(b) Cartography
Question 2.
A map that shows the physical features of an area is called.
(a) Cadastral map
(b) Relief map
(c) Climatic map
(d) Resource map
Answer:
(b) Relief map
Question 3.
Shallow water bodies are represented by color.
(a) Yellow
(b) Brown
(c) Light blue
(d) Dark blue
Answer:
(c) Light blue
![]()
Question 4.
The maps which are known as plans are-
(a) Cadastral maps
(b) Topographical maps
(c) Isoline maps
(d) Transport maps
Answer:
(a) Cadastral maps
Question 5.
Actual distribution of population can be represented by-
(a) lines
(b) Shades
(c) Dots
(d) Contours
Answer:
(b) Shades
II. Fill in the Blanks:
- The globe is the true representation of the ……………
- A way of representing the spherical earth on a flat surface is ……………
- A line that joins the points of equal elevation is ……………
- Cadastral maps are usually maintained by ……………
- …………… map is focused on a specific theme
Answer:
- Earth
- map projection
- Isoline
- Government
- Thematic
![]()
III. Choose the option which matches the following correctly:
(a) Legend – 1. 45%
(b) North East – 2. brown colour
(c) Contour Line – 3. thematic map
(d) Cadastral map – 4. key of a map
(e) Choropleth – 5. taxation
(a) 3,5,1,4,2
(b) 4,1,2,5,3
(c) 2,5,1,3,4
(d) 5,2,4,1,3
Answer:
(b) 4,1, 2, 5, 3
![]()
IV. Match the statement with the reason and select the correct answer:
Question 1.
Statement: Small scale maps can show only major features
Reason: Due to lack of space ,it shows large areas like Continents and countries
(a) Statement is true but reason is wrong
(b) Statement is wrong and reason is correct
(c) Both the statement and reasons are correct
(d) Both the statement and reasons are wrong
Answer:
(c) Both the statement and reasons are correct
Question 2.
Statement: The conventional signs and symbols are the keys of map reading
Reason: These symbols give a lots of information in a limited area
(a) Both the statement and reasons are correct
(b) Statement is wrong and reason is correct
(c) Statement is true but reason is wrong
(d) Both the statement and reasons are wrong
Answer:
(a) Both the statement and reasons are correct
![]()
V. Answer the following in one or two sentences:
Question 1.
Define “Map scale”
Answer:
Map scale is a ratio between the actual distance on the ground and the distance shown on the map.
Question 2.
What is the physical map?
Answer:
The map that shows the physical features of an area is usually called a Physical Map or a Relief Map.
Question 3.
Write a short note on a map projection.
Answer:
A map projection is a way of representing the spherical earth on a flat surface of a map.
![]()
Question 4.
Name the Intermediate directions.
Answer:
The Intermediate directions are north east, north west, south east and south west.
Question 5.
What are the uses of a cadastral map?
Answer:
Cadastral Maps is used for local administration such as city survey, taxation, management of estates and to define property in legal documents.
![]()
VI. Differentiate:
Question 1.
Relief map and thematic map.
Answer:
1. Relief map:
- The map that shows the physical features of an area is usually called a Physical Map or a Relief Map.
- Their primary purpose is to show land forms like deserts, rivers, mountains, plains, plateaus etc.
2. Thematic map:
- A thematic map is a map that focuses on a specific theme or subject area.
- They show the subject such as physical phenomena like temperature variation, rainfall distribution and population density in an area.
Question 2.
Large Scale map and small scale map.
Answer:
1. Large Scale:
- Large scale maps portray the information in more detail than the small scale maps.
- For example, a physical map of India represents a small area of the earth but gives us more information.
2. Small Scale map:
- Small scale maps can show only major features omitting the minor ones due to lack of space.
- For example, physical map of the world will show us only the major physical features in the world.
![]()
Question 3.
Globe and Map.
Answer:
1. Globe:
- Globe gives a three-dimensional representation of the entire world.
- It is a miniature form of the earth (model of the earth).
2. Map:
- The map gives a two-dimensional representation of certain regions or the entire world.
- It is a visual representation of an entire or a part of an area typically represented on a flat surface.
![]()
VII. Answer in a paragraph:
Question 1.
Explain the different types of scales in detail.
Answer:
The different types of scales are Statements or verbal scales.
- Representative fraction
- Graphical or Bar scale
Verbal scale:
The map scale is stated in words (i.e) 1 cm -1 km. It is written on the map like 1 cm – 1km, 1 inch -1 mile, etc.
Representative fraction:
It shows the relationship between the map distance and the corresponding ground distance in the same units of length. It is generally shown as a fraction.
Graphical or Bar Scale:
- A graphic scale looks like a small ruler drawn at the bottom of the page. –
- It is divided and sub-divided into lengths each of which represents a certain distance on the ground.
- The measurements do not change.
![]()
Question 2.
Describe the Cadastral map and its importance.
Answer:
The Cadastral map:
- A cadastral map refers to a map that shows the boundaries and ownership of land within a specified area.
- These maps are sometimes known as plans.
- They are useful for local administration such as the city survey, taxation, management of estates.
- They are used to define property in legal documents.
- They are maintained by the government and they are a matter of public record.
Importance of Cadastral maps:
- Cadastral surveys document the boundaries of land ownership, by the production of documents, diagrams, sketches, plans, charts, and maps.
- They were originally used to ensure reliable facts for land valuation and taxation.
Question 3.
Write a paragraph about the conventional signs and symbols.
Answer:
- The conventional signs are symbols used in maps to represent different features.
- The symbols are explained in the key of the map.
- It gives a lot of information in a limited space.
- The symbols usage can be early drawn in the map and the concept is understood well.
- There is an international agreement regarding the use of certain symbols and others are contextual symbols which are decided by cartographers.
![]()
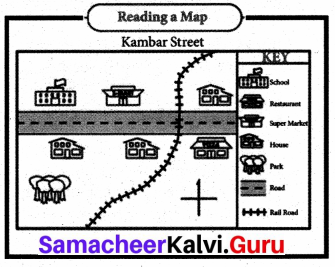
VIII. Students Activity:
- Underline the map title.
- Write N, S, W & E on the compass rose.
- Label the road Kambar Street.
- The rail track runs from Southwest to.
- The park is situated on the rail track.
- Colour the school red.
- Colour the supermarket with brown.
- Colour the restaurant with yellow.
- Colour the house east of the railroad with orange.
Samacheer Kalvi 8th Social Science Geography Map Reading Additional Questions
I. Choose the correct answer:
Question 1.
Map reading is the act of-
(a) Interpreting geographical information
(b) Industrially geographical information
(c) Develops mental maps of the real world
(d) All of the above
Answer:
(d) All of the above
Question 2.
Some of the components of the map.
(a) Title and Scale
(b) Legend and Direction
(c) Source and map projection
(d) All of the above
Answer:
(d) All of the above
Question 3.
Physical map shows.
(a) Physical features
(b) Cities
(c) Industries
(d) Population
Answer:
(a) Physical features
![]()
Question 4.
Scale is represented by-
(a) Veíbal
(b) Representative Fraction
(c) Graphical
(d) All of the above
Answer:
(d) All of the above
Question 5.
Symbols in the key might be-
(a) pictures
(b) icons
(e) both a and b
(d) neither a nor b
Answer:
(c) both a and b
Question 6.
The source should normally be given-
(a) outside the frame of the map
(b) inside the frame of the map
(c) at the top of the map
(d) at the bottom of the map
Answer:
(a) outside the frame of the map
Question 7.
Contextual symbols are decided by the-
(a) government
(b) countries
(c) cartographers
(d) scientists
Answer:
(c) cartographers
![]()
Question 8.
![]() symbol represents.
symbol represents.
(a) Bridge
(b) Baffle field
(e) Foot path
(d) Íain load
Answer:
(a) Bridge
II. Fill in the blanks:
- A map ………….. is a representation of an entire or a part of an area.
- Globe is the miniature form of the …………..
- The art and science of map making in known as …………..
- The content of the map is revealed by its …………..
- A graphical scale looks like a ………….. drawn at the bottom of the page.
- Locational information of an area is given by ………….. and …………..
- Different features on the map are represented by …………..
- Cadastral maps are a matter of ………….. record.
- Cadastre means …………..
- General reference maps do not focus any …………..
- Map showing the distribution of soil is a ………….. map.
- The distribution of atmospheric pressure is represented by …………..
Answer:
- Visual
- earth
- Cartography
- Title
- small ruler
- Conventional signs
- Conventional signs
- public
- Register of Territorial property
- Specific theme
- Qualitative
- Isobar
![]()
III. Match the following:
- Globe – a) Per capital income
- Source – b) Temperature
- Choropleth – c) High Concentration
- Isotherms – d) Model of the Earth
- Many dots – e) Bottom right
Answer:
- d
- e
- a
- b
- c
IV. Match the statement with the reason and select the correct answer:
Question 1.
Statement: A map must indicate direction.
Reason: By means of an arrow printing to the north, the rest of the directions are easily located.
(a) Statement is true but reason is wrong
(b) Statement is wrong and reason is correct
(c) Both the statement and reasons are correct
(d) Both the statement and reasons are wrong
Answer:
(c) Both the statement and reasons are correct
![]()
Question 2.
Statement: A dot density map is a type of Thematic Map.
Reason: Each dot on a dot density map represents some amount of data.
(a) Statement is true but the reason is wrong
(b) Statement and reason are correct
(c) Statement and reason are wrong
(d) Statement is wrong but the reason is Correct.
Answer:
(b) Statement and reason are correct
V. Answer the following one or two sentences:
Question 1.
What is a map?
Answer:
- A map is a visual representation of an entire or a part of an area, typically represented on a flat surface.
- The work of a map is to illustrate specific and detailed features of a particular area, most frequently used to illustrate geography.
Question 2.
What is map reading?
Answer:
Map reading:
- Map reading is the act of interpreting or understanding the geographic information portrayed on a map.
- By map reading, the reader should be able to develop a mental map of real-world information.
- This is done by processing the symbolized information shown on maps.
![]()
Question 3.
Mention the components of a map.
Answer:
The basic components of a map are:
- Title
- Scale
- Legend or key
- Direction
- Source
- Map projection and location information and
- Conventional signs and symbols.
Question 4.
What is meant by the Term Title of the map?
Answer:
Term Title of the map:
- The title tells about the content of the map.
- It is placed mostly at the top comer or at the bottom comer of the map.
![]()
Question 5.
Explain the term ‘Source’ of the map.
Answer:
The term ‘Source’ of the map:
- All maps must show the source of the data used in the respective maps.
- The source should normally be given outside the frame of the map on the bottom right.
- On the bottom left the name of the author, publisher, place of publication, and year of publication must be given.
Question 6.
What is the scale of a Cadastral Map?
Answer:
The scale of a Cadastral Map:
- Cadastral maps commonly range from scales of 1:500 to 1:10,000.
- Large scale diagrams or map shows more precise dimensions and features.
- Example: Buildings, irrigation units, etc. are often prepared by cadastral surveys.
Question 7.
What is Choropleth Mapping?
Answer:
A choropleth map is a Thematic map in which areas are shaded or patterned in proportion to the measurement of the statistical variable being displayed on the map, such as population density or per-capita income.
![]()
VI. Differentiate:
Question 1.
Isoline map and Dot Density Map.
Answer:
1. Isoline map:
- Isolines are lines drawn to link different places that share a common value.
- An Isoline is a line joining equal points. Eg; Isobars, Isotherms, etc.
2. Dot Density Map:
- A dot-density map is a type of Thematic map that uses dots on the map to show the values of one or more numeric data fields.
- Each dot on a dot-density map represents some amount of data. In a dot-density map, areas with many dots indicate a high concentration of values.
![]()
VII. Answer in a paragraph:
Question 1.
What are the uses of maps?
Answer:
Uses of maps:
- To find the location of objects and places
- To find the transportation routes
- Maps showing strategic locations are useful for military
- Serve as a tourist guide
- To find the spatial distribution of different phenomena
- Display weather conditions
- Highly helpful in learning geography
- Represent the real world on a small scale