Students can download 12th Business Maths Chapter 8 Sampling Techniques and Statistical Inference Additional Problems and Answers, Samacheer Kalvi 12th Business Maths Book Solutions Guide Pdf helps you to revise the complete Tamilnadu State Board New Syllabus and score more marks in your examinations.
Tamilnadu Samacheer Kalvi 12th Business Maths Solutions Chapter 8 Sampling Techniques and Statistical Inference Additional Problems
Choose the correct answer:
Question 1.
Non sampling error is reduced by ________
(a) Increasing sample size
(b) Decreasing sample size
(c) Reducing amount of data
(d) None of these
Answer:
(d) None of these
Question 2.
Any numerical value calculated from sample data is called ______
(a) Error
(b) Statistic
(c) Bias
(d) Mean
Answer:
(b) Statistic
![]()
Question 3.
In sampling with replacement a sampling unit can be selected _______
(a) Only once
(b) More than one time
(c) Less than one time
(d) None of above
Answer:
(b) More than one time
Question 4.
Standard deviation of sampling distribution of any statistic is called ________
(a) Sampling error
(b) Type-I error
(c) Standard error
(d) Non-sampling error
Answer:
(c) Standard error
Question 5.
The difference between statistic and parameter is called ________
(a) Random error
(b) Sampling error
(c) Standard error
(d) Bias
(e) Error
Answer:
(e) Error
![]()
Question 6.
In random sampling, the probability of selecting an item from the population is _______
(a) unknown
(b) known
(c) undecided
(d) zero
Answer:
(b) known
Question 7.
Match the following:
| (i) Type I error | (a) determine whether a statistical result is significant |
| (ii) Type II error | (b) Left-tailed test |
| (iii) Hypothesis testing | (c) reject a true null hypothesis |
| (iv) H1 : µ > µ0 | (d) do not reject a false null hypothesis |
| (v) H1 : µ < µ0 | (e) Right-tailed test |
Answer:
(i) – (c)
(ii) – (d)
(iii) – (a)
(iv) – (e)
(v) – (b)
![]()
Question 8.
Fill in the blanks:
- Any statement whose validity is tested on the basis of a sample is called ________
- The alternative hypothesis is also called _______
- The probability of rejecting the null hypothesis when it is true is called ________
- The hypothesis µ ≤ 10 is a _______
- If a hypothesis specifies the population distribution it is called ______
Answer:
- Statistical hypothesis
- Research hypothesis
- Level of significance
- Composite hypothesis
- Simple hypothesis
Question 9.
Null and alternative hypothesis are statements about ________
(a) population parameters
(b) sample parameters
(c) sample statistics
(d) none of the above
Answer:
(a) population parameters
2 and 3 Mark Questions
Question 1.
A random sample of size 50 with mean 67.9 is drawn from a normal population. If the S.E of the sample mean is √0.7, find a 95% confidence interval for the population mean.
Solution:
n = 50, \(\bar{x}\) = 67.9
95% confidence limits for the population mean µ are
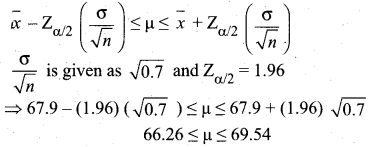
Thus the 95% confidence intervals for estimating µ is given by (66.26, 69.54)
![]()
Question 2.
A random sample of 500 apples was taken from large consignment and 45 of them were found to be bad. Find the limits at which the bad apples lie at 99% confidence level.
Solution:
Sample size n = 500
Proportion of bad apples P = \(\frac{45}{500}\) = 0.09
So proportion of good apples Q = 1 – 0.09 = 0.91
The confidence limits for population proportion are given by,
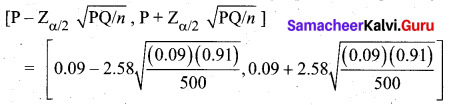
= (0.09 – (2.58) (0.013), 0.09 + (2.58) (0.013)) .
= (0.09 – 0.034, 0.09 + 0.034)
= (0.056, 0.124)
Thus the bad apples lie between 5.6% and 12.4%
Question 3.
A sample of 400 students is found to have a mean height of 171.38 cms can it be regarded as a sample from a large population with mean height 171.17 cms and S.D 3.30 cms?
Solution:
Given
Sample size n = 400
Sample mean \(\bar{x}\) = 171.38 cm
Population mean µ = 171.17 cm
Population SD σ = 3.30 cm
H0 : µ = 171.17 cm
H1 : µ ≠ 171.17 cm
Test statistic:
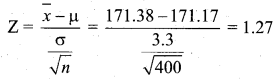
The table value of \(z_{\alpha / 2}\) at 5% level is 1.96. Since Z < \(z_{\alpha / 2}\), H0 is accepted. Therefore the given sample can be regarded as one from the population with mean 171.17 cm.
![]()
Question 4.
An automatic machine fills tea in sealed tins with a mean weight of tea as 1 kg and S.D 1 gram. A random sample of 50 tins was examined and it was found that their mean weight was 999.5 grams. Is the machine working properly?
Solution:
Given
Sample size n = 50
Sample mean \(\bar{x}\) = 999.5 grams
Population mean µ = 1000 grams
Population SD σ = 1 gram
H0 : µ = 1 kg
H1 : µ ≠ 1 kg
Test statistic
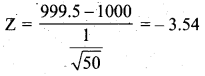
The table value of \(z_{\alpha / 2}\) at 1% level = 2.58. Since |Z| > \(z_{\alpha / 2}\), H0 is rejected. Therefore the machine is not working properly.
5 Marks Questions
Question 1.
A simple random sample of size 100 has mean
(а) 15, the population variance being 25. Find an interval estimate of the population mean with a confidence level of 95% and 99%
(b) If the population variance is not given, what should be done to find out the required estimates?
Solution:
(a) Given
Sample size n = 100
Sample mean \(\bar{x}\) = 15
Population SD σ = 5
The 95% confidence interval for the population mean is \(\bar{x} \pm \mathrm{Z}_{\alpha / 2} \frac{\sigma}{\sqrt{n}}\)
Here \(z_{\alpha / 2}\) = 1.96. So we get
= 15 ± (1.96) (\(\frac{5}{\sqrt{100}}\))
= 15 ± (1.96) (0.5)
= 15 ± 0.98
= 14.02 and 15.98
Therefore 95% confidence interval for population mean µ is (14.02, 15.98)
The 99% confidence interval is \(\bar{x} \pm 2.58 \frac{\sigma}{\sqrt{n}}\)
= 15 ± 2.58 (\(\frac{5}{\sqrt{100}}\))
= 15 ± 2.58 (0.5)
= 13.71 and 16.29
Therefore 99% confidence interval for the population mean µ is (13.71, 16.29)
(b) If population S.D a is not known, then the sample S.D can be used in the place of o in estimating the confidence interval.
![]()
Question 2.
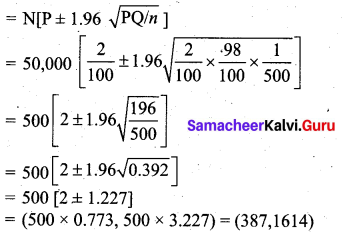
A factory is producing 50,000 pairs of shoes daily. From a sample of 500 pairs, 2% were found to be of sub-standard quality. Estimate the number of pairs that can be reasonably expected to be spoiled at 95% level of confidence.
Solution:
N = 50,000, n = 500, P = \(\frac{2}{100}\), Q = \(\frac{98}{100}\)
The estimated percentage of spoiled pairs in daily production = \(\frac{2}{100}\) × 50,000 = 1000
The limits for the number of spoiled pans at 95% level of confidence
Question 3.
A company that packages peanuts states that at a maximum 6% of the peanut shells contain no nuts. At random, 300 peanuts were selected and 21 of them were empty. With a significance level of 1% can the statement made by the company be accepted?
Solution:
The population proportion P = 6% = 0.06
The null hypothesis: H0 : P ≤ 0.06
Alternative hypothesis: H1 : P > 0.06
For α = 1% = 0.01. Zα = 2.33
The test statistic is P + 2.33 (\(\sqrt{\frac{(0.06)(0.94)}{300}}\)) = 0.092
(where n = 300, P = 0.06, Q = 0.94)
Since the calculated value is less than the table value, 0.092 < 2.33,we accept the null hypothesis H0.
Hence the statement of the company can be accepted.
![]()
Question 4.
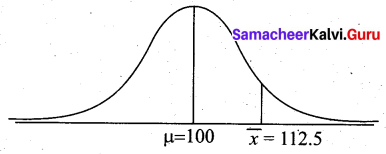
A school principal claims that the students in his school are above average intelligence. A random sample of 30 students IQ scores has a mean score of 112.5. The mean population IQ is 100 with an SD of 15. Is there sufficient evidence to support the principal’s claim?
Solution:
Given
Population mean µ = 100
Population SD σ = 15
Sample size n = 30
Sample mean \(\bar{x}\) = 112.5
Null hypothesis H0 : µ = 100
(the students have average I.Q)
Alternative hypothesis H1 : µ > 100
(the students have above average I.Q scores)
Let the significance level α = 0.05. The table value Zα = 1.645, since this is one-tailed test.
Test Statistic:
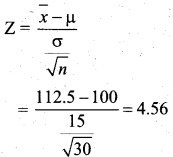
Since 4.56 > 1.645 (ie) Z > Zα at 5% level, we reject the null hypothesis. Hence we conclude that the students have above average IQ scores. So the principal’s claim is right.
![]()
Question 5.
Boys of a certain age are known to have a mean weight of 85 pounds. A complaint is made that the boys living in hostels are underfed. So a sample of 25 boys are weighed and ‘ found to have a mean weight of 80.94 pounds. The population S.D is 11.6. What should be concluded about the complaint?
Solution:
Given n = 25, µ = 85, \(\bar{x}\) = 80.94, and σ = 11.6
Null hypothesis H0 : µ = 85 (the boys are not underfed)
Alternative hypothesis H1 : µ < 85 (the boys are underfed)
Test statistic:
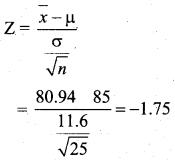
Let us take the significance level α = 0.05. The table value is Zα = -1.645
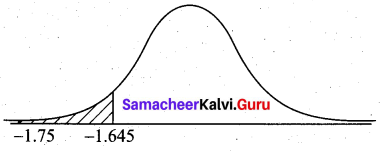
Now -1.75 < -1.645 (i.e) Z < Zα. Therefore we reject the null hypothesis. Since the calculated value falls in the rejection region. Hence we conclude that the boys are underfed. So the complaint should be addressed immediately.