You can Download Samacheer Kalvi 9th Social Science Book Solutions Guide Pdf, Tamilnadu State Board help you to revise the complete Syllabus and score more marks in your examinations.
Tamilnadu Samacheer Kalvi 9th Social Science Geography Solutions Chapter 7 Mapping Skills
Mapping Skills Textual Exercise
I. Choose the correct answer.
Question 1.
The new phase in topographical surveying in the 20th century is ……
(a) toposheets
(b) aerial photography
(c) maps
(d) satellite imagery
Answer:
(d) satellite imagery
Question 2.
…… indicates the purpose or theme of the map.
(a) Title
(b) Scale
(c) Direction
(d) Legend
Answer:
(a) Title
![]()
Question 3.
Standard symbols that are used in maps to convey a definite meaning are called ………
(a) conventional signs and symbols
(b) coordinates
(c) grid references
(d) directions
Answer:
(a) conventional signs and symbols
Question 4.
Which one of the following maps show us a very large area with less details?
(a) Large scale
(b) Thematic
(c) Physical
(d) Small scale
Answer:
(d) Small scale
![]()
Question 5.
GPS consists of a constellation of ……… satellites.
(a) 7
(b) 24
(c) 3.2
(d) 64
Answer:
(b) 24
II. Consider the given statements and choose the right option given below.
Question 1.
Assertion(A): The points at which the vertical and horizontal lines of the grid intersect are called coordinates.
Reason(R): The lines that run horizontally and vertically are called Northings and Eastings respectively.
(a) Both (A) and (R) are true ; (R) explains (A)
(b) Both (A) and (R) are true ; (R) does not explain (A)
(c) (A) is correct; (R) is false
(d) (A) is false ; (R) is true
Answer:
(a) Both (A) and (R) are true ; (R) explains (A)
Question 2.
Assertion(A): The legend of a map does not help us to understand the information in a map. Reason(R): It is usually placed at the left or right comer at the bottom of the map.
(a) (A) is false ; (R) is true
(b) Both (A) and (R) are true ; (R) does not explain (A)
(c) (A) is correct; (R) is false
(d) Both (A) and (R) are true ; (R) explains (A)
Answer:
(a) (A) is false ; (R) is true
III. Match the following:
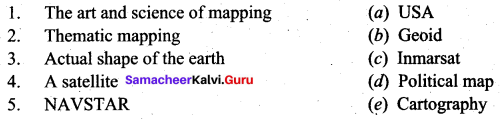
Answers:
1. (e)
2. (d)
3. (b)
4. (c)
5. (a)
IV. Answer in brief
Question 1.
Name the different methods to represent the Earth.
Answer:
- A map is the basic tool of a geographer. It illustrates the earth’s surface clearly and effectively through a combination of drawings, words, and symbols.
- A map projection is a way of showing the spherical-shaped earth on a flat piece of paper.
- A map projection is a systematic transformation of the latitudes and longitudes of location from the surface of a sphere or an ellipsoid into locations on a plane.
- A Globe is a spherical model of earth. Globe Serve similar purposes to maps but unlike maps do not disturb the surface that they portray except to scale it down. A globe of the earth is called a terrestrial globe.
Question 2.
What is a map?
Answer:
A map is the basic tool of a geographer. It illustrates the earth’s surface Clearly and effectively through a combination of drawings, words, and symbols. A map is a location guide.
Question 3.
What are the components of a map?
Answer:
A map should include the following components namely, the title, scale, direction, grid reference, projection, legend, conventional signs, and symbols.
![]()
Question 4.
The distance between the two cities A and B is 5 km. It is represented by a line of 5 cm on the map. Calculate the distance and give the answer in RF.
Answer:
Representative Fraction (R.F.) = Distance on the map / Distance on the ground Given, Distance on the map = 5 cm
The distance on the ground = 5 km
∴ R.F. = 5 cm / 5 km
Converting km to cm; 5 km = 500000 cm
So R.F. is 5 : 500000
i.e. R.F. is 1 : 100000
Question 5.
Mention a few surveying instruments.
Answer:
Geographers mainly use Chain, Prismatic compass, Plane table, Dumpy level, Abney level, Clinometer, Theodolite, Total Station, and GNSS to measure the distance, angle, altitude, and position of the area of survey.
Question 6.
Define remote sensing.
Answer:
Remote Sensing refers to the observation and measurement of earthly objects without touching them. ‘Remote’ means far away and ‘Sensing’ means observing or collecting information. Remote sensing means acquiring information of things/places from a distance, using a variety of tools and methods.
![]()
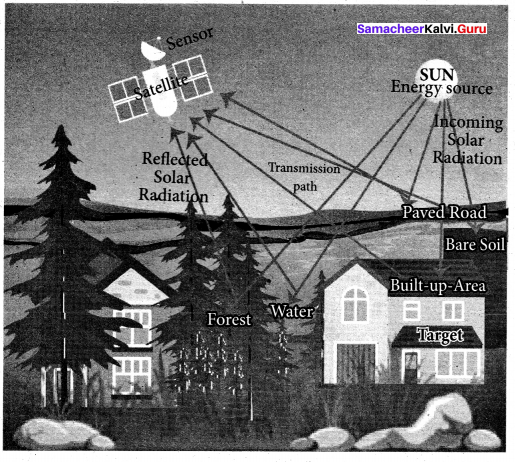
Question 7.
What are the components of remote sensing?
Answer:
Components of remote sensing are
- Energy source
- Transmission path
- Target
- Sensor
V. Give Reasons
Question 1.
Satellite imageries stimulate map making.
Answer:
- Satellite imagery refers to digitally transmitted images of the satellites. Therefore it can be easily integrated with software for the improvement of images.
- Satellites circle the Earth or remain geostationary and therefore, changes in weather or any other natural or man-made modifications do not affect the functioning of Satellites.
Question 2.
A map is the basic tool of a geographer.
Answer:
With maps on hand, one can see the world in one sweep. A map is worth a thousand words. Maps are introduced with its components such as scale, signs and symbols. A map is the basic tool of a geographer. It illustrates the earth’s surface clearly and effectively through a combination of drawings, words and symbols. A map is a location guide.
Question 3.
Grid references are essential to finding the exact location of places on a map.
Answer:
- The location of a place can be simply defined by its latitude and longitude.
- The points at which the vertical and horizontal lines of the grid intersect are called coordinates.
- Therefore grid references are essential to finding the exact location of a place.
![]()
Question 4.
Web cartography is one of the modern mapping techniques.
Answer:
The introduction of web mapping is a major new trend in cartography. The term Web cartography is connected with the design, production, display, and use of maps over the Web. Various types of maps are present on the Web. Until recently cartography was restricted as it required relatively expensive and complex hardware and software as well as skilled cartographers and geomatics engineers.
Web-based GIS has brought many geographical datasets, including free ones generated by OpenStreetMap and proprietary datasets owned by Navteq, Google, Waze, and others. A range of free software to generate maps has also been conceived and implemented alongside proprietary tools like ArcGIS. As a result, the barrier to entry for serving maps on the web has been lowered.
VI. Distinguish Between The Following:
Question 1.
Globe and Map
Answer:
| Globe | Map |
| It is a representation of the whole earth with the clear marking of longitude and latitude of all the places on earth. | A map illustrates the earth’s surface more clearly and effectively through a combination of drawings, words and symbols. |
Question 2.
Large scale map and small scale map
Answer:
| Large scale map | Small scale map |
| Large amount of detail is shown of a small area can be seen in a large-scale map. | Small amount of detail of a larger area can be seen in a small scale map. |
Question 3.
Aerial photographs and satellite imageries
Answer:
| Aerial photographs | Satellite imageries |
| It covers a small area and needs permission from the authorities. | It allows global coverage and does not require permission. |
| Revisits or repeatability involves extra cost. | Satellites circle the Earth; they can repeat and revisit easily. |
Question 4.
GIS and GPS
Answer:
| GIS | GPS |
| Geographic Information System is a computer-based tool for managing a large amount of data collected for a given geographic region through remote sensing, GPS and other sources. | GPS is the U.S. implementation of the world’s first and currently the most used Global Navigation Satellite System (GNSS) created by the U. S. Department Of Defense. |
| GIS finds its strongest use in resources management, telecommunications and urban and regional planning. | Weather forecasting, earthquake monitoring and environmental protection can be done effectively by using GPS. |
VII Answer in a paragraph:
Question 1.
What do you mean by the term ‘scale of the map’? Explain its classification.
Answer:
- Scale is one of the components of a map.
- Scale makes it possible to reduce the size of the whole earth to show it on a piece of paper.
- A scale is a ratio between the actual distance on the map to the actual distance on the ground.
- Scales can be represented in three methods. They are
- Statement
- Representative Fraction (R.F)
- Linear or Graphical scale methods.
(a) Statement Scale:
The statement scale describes the relationship of map distance to the ground distance in words, such as one centimetre to ten kilometres. It is expressed as 1cm = 10 km.
(b) The Representative Fraction (R.F):
- It describes the proportion or ratio of the map distance to ground distance. It is usually abbreviated as R.F. It is stated as 1/100000 or 1:100000
- This means that one unit on the map represents 100,000 of the same unit on the ground.
- This unit may be an inch or a centimetre or any other linear measurement unit.
Representative Fraction (R.F.) = \(\frac { Distance on the map }{ Distance on the Ground }\)
(c) Linear (or) Graphical scale: In geography, a linear scale is represented by a straight line divided into equal parts (Primary and secondary) to show what these markings represent on the actual ground. This scale helps in the direct measurement of distance on the map.
![]()
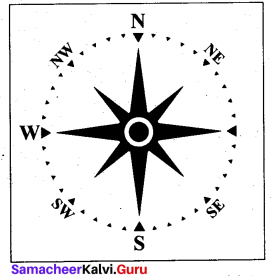
Question 2.
Write a note on directions with a relevant diagram.
Answer:
Direction
Maps are drawn normally with north orientation. The North direction in a map is always towards the North Pole of the earth. If you position yourself looking at the North Pole, on your right will be the east; your left will be the west; at your back will be south. These four main directions are called the cardinal directions. The direction is usually indicated on a map by a North-South line, with the North direction represented by an arrow head.
Question 3.
What are the three major functional segments of GPS? Explain about anyone.
Answer:
GPS has made a considerable impact on almost all positioning, navigation, timing and monitoring applications. It provides particularly coded satellite signals that can be processed in a GPS receiver, allowing the receiver to estimate position, velocity and time.
- The (GPS) Global Positioning System is a U.S. owned utility that provides users with positioning, control segment and the user segment.
- The GPS ground segment (also referred to as control segment or operational control system) is responsible for the proper operation of the GPS system.
- The GPS control segment is composed of network of monitor stations (MS), a Master Control Systems (MCS) a backup of the MCS and Ground Antenna (GA).
- The GPS space segment consists of a constellation of transmitting radio signal to users. The linked states is committed to maintaining the availability of atleast 24 operational GPS satellites, 95% of the times.
- The user segment is the practice of dividing all customers into segments based on characteristics they share. For example sorting users by region, language, or behaviour.
Question 4.
Bhuvan has tremendous uses for scientists, policymakers, or the general public. Justify.
Answer:
Bhuvan (Sanskrit for Earth) is a free internet-based computer application launched by the Indian Space Research Organization (ISRO) on August 12th, 2009. It enables visualization of Indian Remote Sensing (IRS) images taken over a year ago, by ISRO’s seven satellites, including CartoSat-1 and CartoSat-2. Using Bhuvan connected to the Internet, one can explore places of interest, scenes of events in the news or parts around the world they may never visit in person, by either entering the names of places or coordinates (latitudes and longitudes). Bhuvan has tremendous uses for scientists, academicians, policymakers, and the general public.
Advantages
- Bhuvan, due to 3D rendering, gives the impression of moving through real space through the entire globe
- Students can use Bhuvan to understand subjects ranging from Sciences to History of places.
- It provides information on natural resources and timely information on disasters.
- Administrators use it for monitoring various developmental schemes.
VIII. HOTS:
Question 1.
Can you imagine a world without satellites?
Answer:
- Today a growing number of satellites orbit around the Earth, making various earth observation, communication, navigation, and science application possible.
- While we may not always realize or acknowledge their existence, the important role these systems play in our daily lives cannot be underestimated.
- As technology advances, the potential of satellites will undoubtedly continue to grow. New markets will merge along with new opportunities to push the boundaries of what space technology currently offers.
- Likely satellites reach just about everywhere today. In certain isolated parts of our planet. Satellites provide inhabitants with access to telephone service, 4G / 5G, broadband, and work.
- GPS helps us to travel from A to B without getting lost along the way.
Question 2.
Imagine you are a cartographer. Plan and bring out a few ideas to improve your area.
Answer:
Cartographers are trained in aerial photography and in collecting survey data for preparing maps, charts and sketches.
They work to create detailed information maps based on survey data.
Ideas to improve Chennai
- Maintaining the ecological process in Chennai.
- Balancing the essential infrastructures of the urban areas.
- Improving the connectivity in and around South Chennai from the main city.
- Improving Civic Services
Chennai Corporation is set to upgrade its Geographical Information System (GIS) services. This was used for the creation of a digital base and Utility mapping using GIS technology in 44,000 streets in Chennai.
(Students can add their own creative ideas)
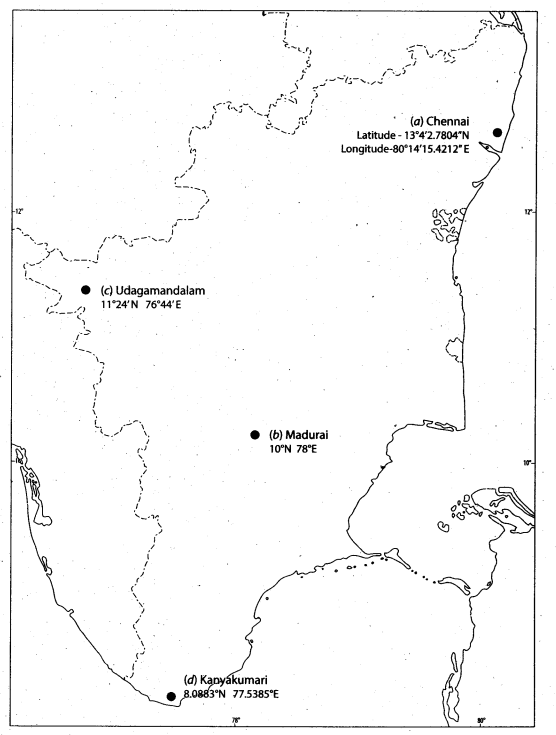
IX Map skill:
A. With the help of an atlas, mark the following on the outline map of Tamil Nadu.
a. The latitude and longitude of Chennai. .
b. Mark the city located at 10° N, 78° E.
c. Locate the city approximately on 11°N and 76°E.
d. Find the latitude and longitude of Kanyakumari and mark it.
Mapping Skills Additional Questions
I. Choose the correct answer.
Question 1.
The first ancient Greek to draw a map of the Known World is ………
(a) Anaximander
(b) Gerardus Mercator
(c) Felix Nadar
(d) None of these
Answer:
(a) Anaximander
Question 2.
The foundation for map-making in India was laid during the …… period.
(a) Pre-historic
(b) Medieval
(c) Vedic
(d) Modern
Answer:
(c) Vedic
Question 3.
……. is a way of showing the spherical shaped earth on a flat piece of paper.
(a) Direction
(b) Grid Reference
(c) Projection
(d) Legend
Answer:
(c) Projection
![]()
Question 4.
……… symbols are used to indicate railways, roads, power lines, telephone lines in
mapping.
(a) Line
(b) Point
(c) Area
(d) None of these
Answer:
(a) Line
Question 5.
Maps produced by analysis can be used to pinpoint problem areas.
(a) GPS
(b) GIS
(c) GNSS
(d) DoD
Answer:
(b) GIS
II. Find out the correct statement.
Question 1.
Assertion (A): A linear scale is represented by a straight line divided into equal parts to show what these markings represent on the actual ground.
Reason (R): This scale helps in the direct measurement of distance on the map.
(a) Both A and R are true; R explains A
(b) Both A and R are true; R does not explain A
(c) A is correct and R is wrong
(d) A is wrong and R is correct
Answer:
(a) Both A and R are true; R explains A
Question 2.
Assertion (A): Satellites do not collect large amounts of data of the entire area in a short span. Reason (R): Sensors in the satellites record the reflected and emitted radiation.
(a) A is wrong and R is correct
(b) Both A and R are hue; R does not explain A
(c) A is correct and R is wrong
(d) Both A and R are true; R explains A
Answer:
(a) A is wrong and R is correct
III. Match the following:
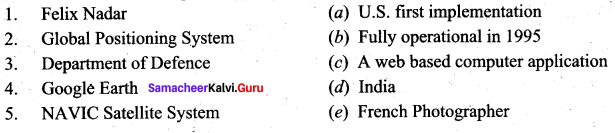
Answers:
1. (e)
2. (a)
3. (b)
4. (c)
5. (d)
IV. Answer in brief.
Question 1.
Mention the first mapmaker.
Answer:
Anaximander was the first ancient Greek to draw a map of the known world. It is for this reason that he is considered by many to be the first mapmaker (the first cartographer).
Question 2.
Who is a Cartographer? What is Cartography?
Answer:
A cartographer is one who measures, analyzes, and interprets geographical information to create maps and charts for political, cultural, and educational purposes. The art and science of map-making are called Cartography.
Question 3.
What do you mean by ‘Direction’?
Answer:
Maps are drawn normally with north orientation. The North direction in a map is always towards ‘ the North Pole of the earth. If you position yourself looking at the North Pole, on your right will be the east; your left will be the west; at your back will be south. These four main directions are called the cardinal directions. The direction is usually indicated on a map by a North-South line, with the North direction represented by an arrowhead.
![]()
Question 4.
What is Projection? Mention the three methods in widest use.
Answer:
A map projection is a way of showing the spherical shaped earth on a flat piece of paper.
The three methods in widest use are as follows:
- Projection on the surface of a cylinder
- Projection on to the surface of a cone
- Projection directly onto a flat plane called planar or zenithal or azimuthal projection
Question 5.
Remote sensing can be either passive or active – Explain.
Answer:
- Remote sensing can be either passive or active.
- Active systems emit their own source of light energy such as RADAR.
- Passive systems depend on sunlight as an energy source.
Question 6.
What are the types of Maps?
Answer:
(a) On the basis of scale, maps can be classified into:
- Large scale maps: A large amount of detail; can only show a small area.
- Small scale map: Small amount of detail; can show a large area.
(b) On the basis of utility and purpose, they are classified as:
- General maps / Topographic Maps (physical and political maps)
- Thematic map (spatial variations of single phenomena)
- Special purpose maps (Braille maps for blind people, maps for neo literates, military maps, navigational charts, etc).
Question 7.
What are the geo objects?
Answer:
- Geographical objects in the real world are matched to program objects known as geo objects.
- Geo objects include placemarks, circles, polylines, rectangles, polygons, and their collections.
- Place markers indicate a place on a map.
V. Give reasons
Question 1.
The foundation for map-making in India was laid during the Vedic period.
Answer:
The foundation for map-making in India was laid during the Vedic period. Mahabharata conceived a round world surrounded by water. Surveying and map-making were an integral part of the revenue collection procedure in the medieval period. E.g.: Sher Shah Suri’s revenue maps and Rajendra Chola’s land survey techniques.
Question 2.
Conventional signs and symbols are standard symbols used on a map.
Answer:
- A map is a global language and it needs to be drawn according to the international standards
- Conventional signs and symbols are standard symbols used on a map and explained in the legend to convey a definite meaning.
Question 3.
“GPS helps in providing accurate transport data”.
Answer:
- GPS technology has tremendous applications in everything.
- It helps in military searches and rescue in wars.
- It can work as a reliable tourist guide (distance, route and direction)
VI. Distinguish between the following.
Question 1.
Maps and Cartography
Answer:
| Maps | Cartography |
| Maps are drawings of an area as seen from above. Maps can show a whole or part of the world. | The art and science of map-making are called cartography. |
VII. Answer in a paragraph.
Question 1.
What is Satellite Remote Sensing? Explain the
(a) components of Remote Sensing
(b) process of Remote Sensing.
Answer:
Satellite remote sensing is the science of collecting data about an object or area from artificial satellites orbiting the Earth. The term ‘satellite imagery’ refers to digitally transmitted images of the satellites.
Components of remote sensing
- Energy source
- Transmission path
- Target
- Sensor
Process of remote sensing
- The EMR (Electro-Magnetic Radiation) or solar radiation is the primary source of energy for remote sensing.
- Sunlight travels from the sun through the atmosphere, before it reaches the earth’s surface. In the atmosphere, the sun’s rays are not obstructed by any object.
- When solar radiation falls on the earth’s surface, some of its energy is absorbed. While some are transmitted through the surface, the rest is reflected. Surfaces naturally emit radiation in the form of heat. The reflected energy travels from the earth’s surface back to space.
- Sensors in the satellite record the reflected and emitted radiation. Each surface/object possesses a characteristic spectral signature, a unique pattern of reflecting sunlight.
- The energy recorded by the sensor has to be transmitted to a ground station where the data are processed into an image.
- The processed image is interpreted either visually by human interpreters or by computer-aided techniques called digital image processing to identify and distinguish between the different spectral signatures to get information about objects/places.
- Finally, we understand and apply the extracted information in mapping the area or assist in solving a particular problem.
Question 2.
Describe the
(a) Advantages of Remote Sensing
(b) Disadvantages of Remote Sensing
(c) Remote Sensing and Disaster Management
Answer:
(a) Advantages of Remote Sensing
- It is the only practical way to obtain data from inaccessible regions, e.g. Antarctica, Amazon forest.
- It helps in constructing cheap base maps in the absence of detailed land surveys.
- It detects the spread of natural calamities such as flood, forest fire and volcanic eruption, so that immediate rescue operations and planning can be carried out.
(b) Disadvantages of Remote Sensing
- It is difficult to prepare large scale maps from obtained satellite data.
- The technique is very expensive for small areas requiring one-time analysis.
(c) Remote Sensing and Disaster Management
Remote sensing technology is highly used in disaster management to study the effects of earthquakes, tsunamis, cyclones, volcanic eruption, floods and wildfires. The preliminary data is retrieved from satellites like LANDSAT, CARTOSAT, OCEANSAT, etc. Fire and flood details can be extracted and delivered to relevant authorities within two hours of satellite image capture. E.g. major earthquakes in China and New Zealand, bushfire in Victoria and floods in Kerala. Dynamic phenomena such as floods, movement of wild animals, shoreline changes, finding lost ships and planes. Researchers use satellite imageries for these.