You can Download Samacheer Kalvi 6th Maths Book Solutions Guide Pdf, Tamilnadu State Board help you to revise the complete Syllabus and score more marks in your examinations.
![]()
Tamilnadu Samacheer Kalvi 6th Maths Solutions Term 1 Chapter 5 Statistics Additional Questions
Question 1.
A _____ is a collection of numbers gathered to give some meaningful information.
Solution:
Data
Question 2.
The data can be arranged in a tabular form using ____ marks
Solution:
Tally
Question 3.
A observation occurring 8 times in a data is represented as _____ using tally marks.
Solution:
![]()
Question 4.
Tally marks ![]() represents _____
represents _____
Solution:
6
Question 5.
Following are the choice of sports for 20 students of class VI.
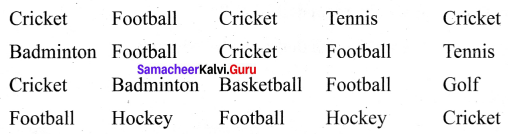
Arrange the names of sports in a table using tally marks.
Solution:
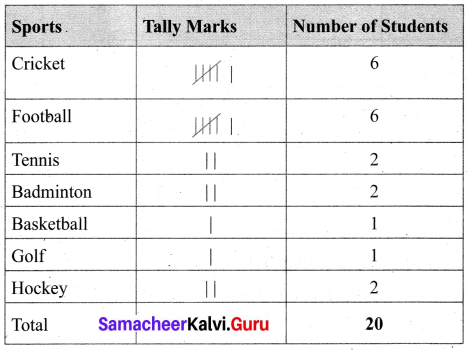
![]()
Question 6.
Mariana threw a die 40 times and noted the number appearing each time as shown below.
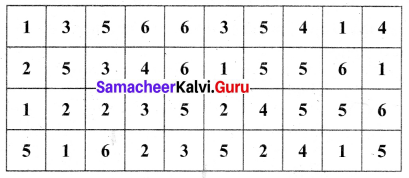
Make a table and enter the data using tally marks.
Find the number that appeared
(a) the minimum number of times
(b) the maximum number of times
(c) Find those numbers that appear an equal number of times.
Solution:
Table using Tally Marks
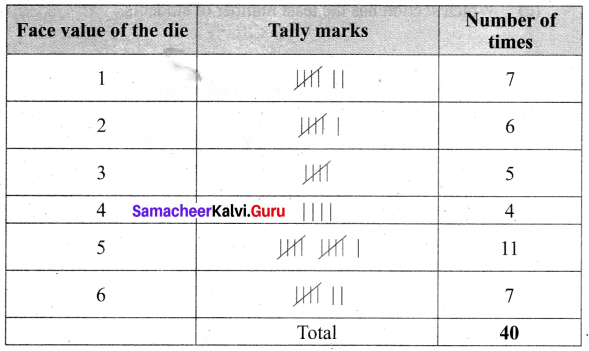
(a) The number ‘4’ appeared the minimum number of times
(b) The number ‘5’ appeared the maximum number of times
(c) Numbers ‘1’ and ‘6’ appeared the equal number of times.
Question 7.
What is the advantage of using pictograph?
Solution:
The data can be analyzed and interpreted. The pictures and symbols help us to understand better.
Question 8.
Total number of students of a school in different years is shown in the following table
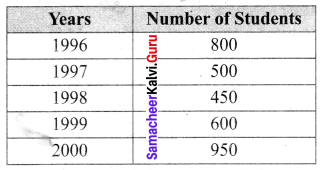
(A) Prepare a pictograph of students using one symbol to represent 100 students and answer the following questions
(a) How many symbols represent the total number of students in the year 2000?
(b) How many symbols represent the total number of students in the year 1997?
Solution:
(A) The pictograph is given by
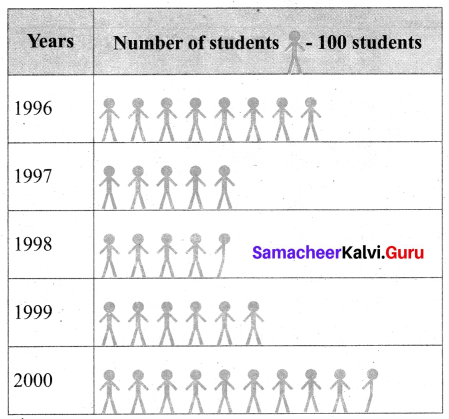
(a) 9 Full pictures and a half picture represent the number of students in the year 2000
(b) 5 symbols.
![]()
Question 9.
The number of bottles of honey sold by three different shops are given below.
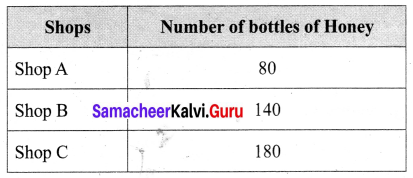
(A) Draw a pictograph and answer the following questions (use the scale – 20 bottles)
(a) What is the total profit of shop A, if the profit gained on each bottle is ‘E’150?
(b) If the total number of bottles sold is 400 how many figures must be drawn to shops?
(c) Find the difference between the number of bottles sold by shop B and the number of bottles sold by shop ‘C’.
Solution:
(A) Pictograph of number of bottles sold
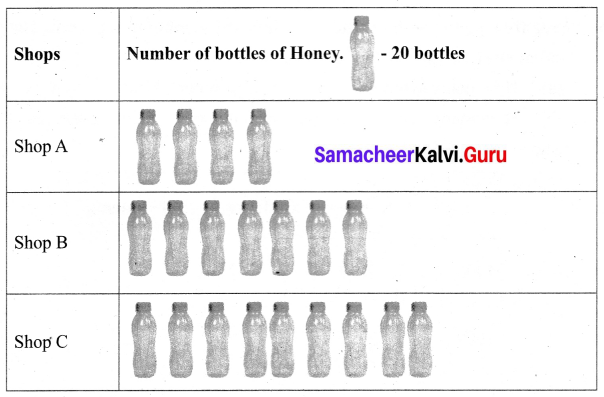
(a) Profit per bottle = ₹ 150
Shop A’s total profit = 80 × 150 = ₹ 12,000
(b) For 400 bottles, the figures to be drawn is \(\frac{400}{20}\) = 20 bottles for shop ‘C ’
(c) Difference = No. of bottles sold by shop ‘C’ – No. of bottles sold by shop ‘B’ = 180 – 140 = 40 bottles
Question 10.
The following data is the total savings of a group of 5 friends in a year.
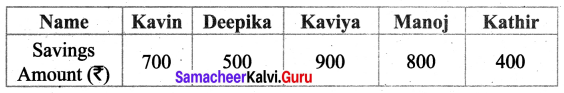
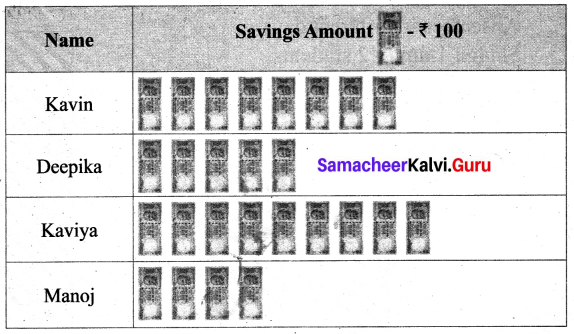
Draw a pictograph to represent the data.
Solution:
Question 11.
The number of mathematics books sold by a shopkeeper on six consecutive days is shown below.
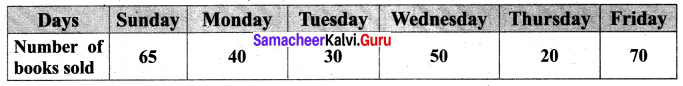
Draw a bar graph to represent the above information choosing the scale of your choice.
Solution:
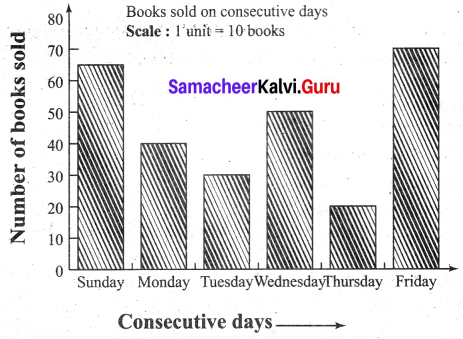
![]()
Question 12.
The following bar graph shows the number of people visited Mahabalipuram over a period of 5 months.
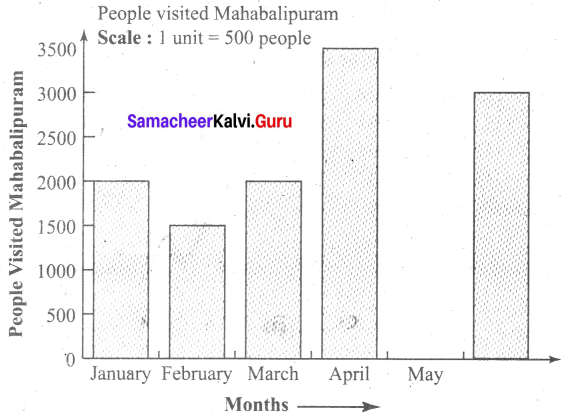
Use the graph to answer the following questions
(a) How many people visited Mahabalipuram in April?
(b) How many more people visited Mahabalipuram in May than in January?
(c) In which month, were there as many visitors as in March?
(d) In which month was there 1500 more visitors than in January?
(e) How many visitors were there in 5 months?
Solution:
(a) 3500 people visited Mahabalipuram in April
(b) 500 more people
(c) January
(d) April
(e) 11,500 people
![]()